
Inconsistent entries kill scalping accounts faster than bad setups do. You get into a trade a candle too late, your stop gets hit, and the move plays out perfectly without you. That frustration is almost always an indicator problem, not a market problem. Most scalpers stack up tools without understanding what each one is actually supposed to tell them, and that gap between having indicators and using them correctly is where most short-term traders bleed money. This guide breaks down exactly how to use trading indicators with purpose, precision, and a clear process that actually holds up under live market conditions.
Table of Contents
- Understand the role of indicators in scalping
- Essential indicators for scalpers: types and purposes
- How to use trading indicators: step-by-step strategy
- Common mistakes and how to troubleshoot indicator-based scalping
- Why advanced indicator use beats copying strategies
- Level up your scalping with powerful indicators
- Frequently asked questions
Key Takeaways
| Point | Details |
|---|---|
| Indicators are tools, not crutches | Use each indicator to serve a specific role—trend, momentum, volatility, or execution. |
| Prioritize short timeframes | Trading indicators give clearer signals on 1–15 minute charts in trending or range-bound markets. |
| Backtest before trading live | Always validate indicator setups on your asset and timeframe to avoid costly mistakes. |
| Avoid indicator overload | More indicators can create confusion—keep your setup lean and purposeful. |
| Refine with real-world feedback | Continuously optimize your indicator choices based on live trading performance and outcomes. |
Understand the role of indicators in scalping
To address these challenges, let's clarify what indicators actually do for you in the scalping context. Indicators are not magic signals. They are mathematical calculations applied to price and volume data, and each one is designed to answer a specific question about the market.
There are three core questions every scalper needs answered before entering a trade:
- What direction is price moving? Trend indicators answer this.
- How strong or exhausted is that move? Momentum indicators answer this.
- How far could price realistically move, and where should my stop sit? Volatility indicators answer this.
According to Top Technical Indicators for a Scalping Trading Strategy, indicators for scalping are mainly used to identify trend and momentum, measure volatility, and provide confirmation for precise entries and exits. They work best on intraday charts at or below 15 minutes when conditions are either trending or clearly range-bound.
That last part is important. You can learn more about practical intraday indicator uses for short-term setups, but the honest truth is that indicators lose their edge when market conditions are choppy or conflicted. Recognizing those regimes and stepping aside is itself a skill.
"An indicator only answers the question it was designed to answer. Use it outside that scope and it becomes noise, not signal."
When price is grinding sideways with no clear structure, most indicators will chop in and out of buy and sell zones repeatedly. Waiting for trending or clearly defined range-bound conditions before activating your indicator-based entries is one of the most underrated edges in scalping.

Essential indicators for scalpers: types and purposes
Now that you understand their roles, let's see which specific indicators serve each scalping objective. The table below maps common indicators to their primary function, the timeframes where they perform best, and what they should tell you in real time.
| Indicator | Type | Primary function | Best timeframe | Key output |
|---|---|---|---|---|
| EMA (8, 21) | Trend | Direction bias | 1m, 3m, 5m | Bullish or bearish slope |
| RSI (14) | Momentum | Overbought/oversold zones | 5m, 15m | Value above/below 50 or 70/30 |
| Stochastics | Momentum | Mean reversion timing | 1m, 5m | %K and %D crossovers |
| ATR (14) | Volatility | Stop-loss distance, position sizing | Any | Dollar or pip value per bar |
| VWAP | Execution | Institutional price reference | 1m, 5m | Fair value anchor for entries |
| Bollinger Bands | Volatility | Range expansion, squeeze breakouts | 5m, 15m | Band width and price position |
Each tool fills a specific role. The top scalping indicators used by experienced short-term traders are not necessarily the most complex ones. They are the ones that answer the right question at the right time.
Here is a breakdown of how each type functions in practice:
- Trend indicators (EMAs): A fast EMA crossing above a slow EMA signals upward momentum. Price staying above both EMAs confirms a bullish bias. Simple, but effective when conditions are clean.
- Momentum indicators (RSI, Stochastics): RSI below 30 on a 5-minute chart during a pullback in an uptrend is a strong signal to look for long entries. Stochastics with a bullish crossover in oversold territory adds confirmation.
- Volatility indicators (ATR): ATR is used by intraday and scalping traders to quantify volatility for position sizing and to set dynamic stop distances. It does not tell you direction, only how much room price typically needs to breathe.
- Execution indicators (VWAP): Price reclaiming VWAP after a dip on a 1-minute or 5-minute chart is a high-probability long signal that institutional desks also watch.
Pro Tip: If you are just starting out on lower timeframes, focus on the 1-minute time frame with just two indicators: a fast EMA for direction and ATR for stop placement. Add confluence tools only once you are comfortable executing on those two.
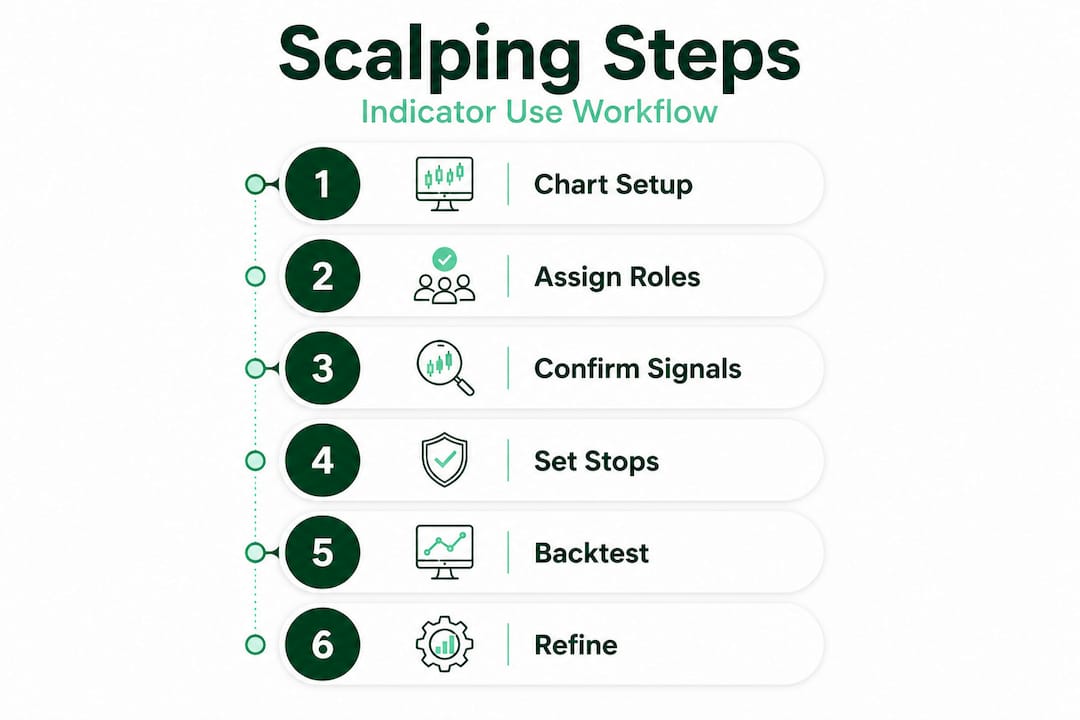
How to use trading indicators: step-by-step strategy
With a foundation in indicator roles and examples, let's walk through a practical process to use them effectively. The biggest mistake traders make is building a chart that looks impressive without following a repeatable process. Here is the step-by-step system we recommend for structured indicator use in scalping.
Step 1: Define your chart setup
Choose your asset (BTC/USD, EUR/USD, or your preferred pair), set your timeframe (1m to 15m), and load a clean indicator template. Less is more. Start with three indicators maximum: one for trend, one for momentum, and one for volatility.
Step 2: Map each indicator to one purpose
Do not let indicators overlap in function. If you already have RSI for momentum, adding MACD does the same job. Every indicator on your chart should answer a different question. As Investopedia confirms, the right approach is mapping each indicator to a purpose, then validating with backtesting or demo trading rather than copying settings blindly from another trader.
Step 3: Confirm alignment before entering
An entry signal only qualifies when all three indicator types agree. For a long trade:
- Trend indicator shows bullish direction (price above EMA, upward slope)
- Momentum indicator shows a non-overbought reading or bullish crossover
- Volatility indicator confirms adequate movement potential relative to your stop distance
Step 4: Set your stop using ATR
Take the current ATR reading and multiply by 1.5 to 2.0 to get your stop-loss distance in price terms. This keeps stops dynamic and prevents them from being clipped by normal intraday volatility.
Step 5: Backtest your setup
Before going live, scroll back through at least 50 to 100 trade setups on your chart using your chosen indicator combination. Note win rate, average risk-to-reward, and conditions where the setup underperforms. You should explore a detailed indicator-based scalping playbook to structure this review properly.
Step 6: Refine and repeat
Most scalpers make the error of adjusting settings after a few bad trades rather than evaluating over a statistically meaningful sample. Commit to at least 30 trades before changing anything.
| Setup phase | Action | Goal |
|---|---|---|
| Chart prep | Load 3 indicators, clean layout | Clarity and speed |
| Entry criteria | All 3 types must align | Reduce false signals |
| Stop placement | ATR x 1.5 to 2.0 | Dynamic, market-based risk |
| Backtesting | 50 to 100 historical setups | Validate before live trading |
| Review cycle | Every 30 trades | Incremental improvement |
Pro Tip: Run your backtests during both trending and range-bound sessions. A setup that works well in a trending market might give many false signals during a low-volatility consolidation period.
Common mistakes and how to troubleshoot indicator-based scalping
Even with a process in place, many traders fall into familiar traps. Here is how to avoid and fix them.
Mistake 1: Indicator overload
Loading six or more indicators creates contradictions. One signals buy, another signals sell, and you freeze. The fix is to strip your chart back to the core three-indicator framework and only add a tool when you can clearly define its role.
Mistake 2: Copying settings blindly
A trader on a forum shares their RSI with custom settings and shows incredible backtest results. You copy them. But their asset, timeframe, and risk tolerance are completely different from yours. Signal quality issues from misapplied settings are one of the top reasons scalpers see inconsistent results. Always verify settings on your own historical data before committing.
Mistake 3: Ignoring market regime shifts
An indicator combination that performs brilliantly during a trending session can destroy your account during a news-driven choppy session. Indicators are less effective during confused or conflicting market regimes. Recognizing when to step back is part of indicator mastery.
"Your indicators did not stop working. The market conditions changed. Know the difference."
Mistake 4: Skipping demo or paper trading
Going live with an untested setup is gambling, not trading. Paper trade your indicator strategy for at least two weeks in live market conditions before risking real capital. The Edge Finder indicator approach of validating entries before execution is worth studying as a discipline model.
Here are the key warning signs that your indicator setup needs adjustment:
- Win rate drops below 40% over 30 or more trades
- You are experiencing frequent stop-outs at exactly your stop level
- Your momentum indicator is constantly in overbought or oversold territory with no resolution
- Trend signals are reversing within one to two candles of your entry
Each of these symptoms points to a specific fix, whether that is adjusting ATR multipliers, switching timeframes, or reducing indicator count.
Why advanced indicator use beats copying strategies
Here is our honest take on what separates consistently profitable scalpers from traders who cycle through strategy after strategy looking for something that finally "works."
Most trading education focuses on what indicators to use. Very little of it focuses on how to think about the role each indicator plays. The traders who perform at the highest level over long periods are not using some secret combination. They understand why each tool is on their chart and what conditions make it reliable or unreliable.
Copying a strategy from social media gives you the indicator settings but not the understanding behind them. When the setup stops working, and every setup will eventually encounter a rough patch, you have no framework for troubleshooting it. You just switch to the next thing someone is posting about.
The traders who build real edge through custom algo indicators consistently outperform because they have verified their setups across multiple market conditions on their own charts and their own assets. They know exactly what their setup is designed to catch, and they know when conditions are not favorable.
The creative, hands-on approach also builds execution confidence. When you understand why your indicators are aligned, you enter with conviction rather than hesitation. That psychological shift has a real impact on your ability to hold trades to target instead of exiting early.
One practical habit: document every trade with a screenshot showing your indicators at entry and exit. Review that log weekly. Over time, you will start to see the exact conditions where your setup wins and where it fails. That pattern recognition is impossible to develop by copying someone else's settings.
Level up your scalping with powerful indicators
Ready to turn this knowledge into real results? The gap between understanding indicators and executing them at speed in live markets is where premium tools make a genuine difference.
The Smart Scalping Signals tool at Scalping-Algo is built specifically for traders who want non-repainting, real-time signals optimized for 1-minute to 15-minute timeframes in crypto and forex. It integrates trend direction, momentum confluence, and volatility gating into a single, clean signal output so you spend less time analyzing and more time executing. For traders who want a full institutional-grade suite, the Algo Master Suite includes backtesting, live alerts, and Discord-connected signals that keep you sharp and informed during every session.
Frequently asked questions
What is the best indicator combination for scalping?
A blend of one trend indicator like a moving average, a momentum tool such as RSI, and a volatility gauge like ATR covers core scalping needs for identifying trend, momentum, and precise entry confirmation.
How do I set stop-losses with indicators in scalping?
Use ATR to calculate dynamic stop-loss distances based on real-time volatility. Since ATR quantifies volatility for intraday and scalping traders, multiplying the ATR value by 1.5 to 2.0 gives a stop that adjusts automatically as market conditions change.
Are trading indicators effective for scalping crypto and forex?
Yes, especially on clear trending or range-bound charts. Indicators work best on intraday charts at or below 15 minutes, making them well suited for crypto and forex scalping when market structure is defined.
What is the risk of using too many indicators at once?
Adding too many indicators produces conflicting signals and decision paralysis, which slows execution and increases errors. Stick to three indicators with distinct roles: one for direction, one for momentum, and one for volatility.
Can I use indicator templates from other traders?
Use them as a starting point only. Blindly copying templates fails because settings need to match your specific timeframe and asset. Always validate with backtesting on your own chart before applying to live trading.