Even experienced scalpers miss profitable setups when they're jumping between five separate charts, three indicator windows, and a live news feed all at once. The market doesn't wait for you to catch up. A trading dashboard solves this by pulling every critical signal into one unified view, letting you read the market and act in seconds rather than minutes. This guide breaks down exactly what trading dashboards are, what makes one genuinely useful for scalping, and how to avoid the traps that trip up even seasoned traders.
Table of Contents
- What is a trading dashboard?
- Core components of a scalping dashboard
- How trading dashboards empower scalpers
- Common pitfalls and how to avoid dashboard traps
- How to choose or build the right trading dashboard
- Why mastery of dashboards matters more than dashboard choice
- Take your scalping to the next level with pro-grade dashboards
- Frequently asked questions
Key Takeaways
| Point | Details |
|---|---|
| Dashboards unify signals | Combining charts, order flow, alerts, and journaling in one interface lets scalpers make split-second decisions. |
| Watch for data lags | Even pro dashboards can show lag or discrepancies during high volatility, so always verify key moves. |
| Confluence drives confidence | Spotting multiple confirming signals on one dashboard sharpens trading accuracy and timing. |
| Customization is key | The best dashboard is the one tailored to your strategy, tools, and speed requirements. |
What is a trading dashboard?
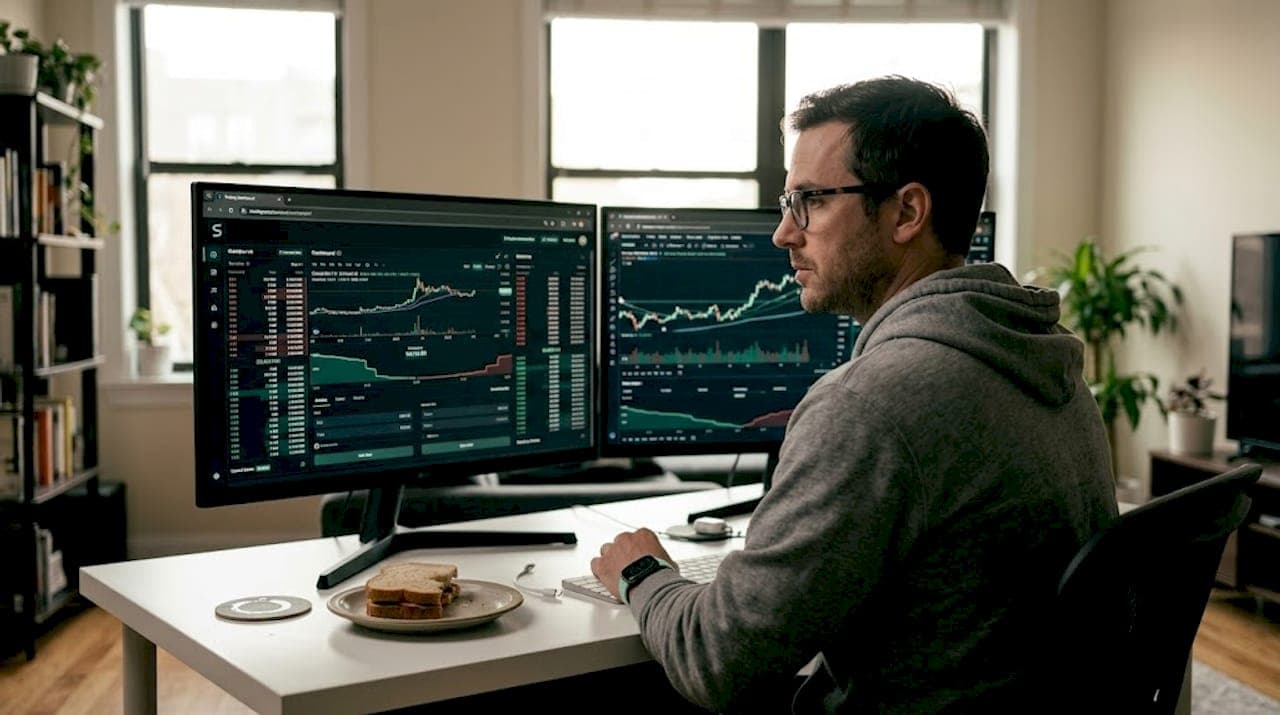
A trading dashboard is an all-in-one control center that displays the market data, signals, and tools you need to make fast, confident decisions without switching between windows. For scalpers specifically, this isn't just a convenience feature. It's a competitive necessity.
Think about what a typical scalping session looks like without a dashboard. You're watching a 1-minute BTC/USDT chart, you spot a potential entry, but you need to check the 5-minute trend, verify volume, glance at your RSI divergence indicator, and confirm the spread is tight enough to make the trade worthwhile. By the time you've done all that, the setup is gone.
A well-built dashboard collapses all of that into a single glance. Platforms like Quantower and cTrader offer professional-grade unified environments, while TradingView scripts and custom-built solutions using tools like Streamlit let traders build something tailored to their exact workflow. The debate between "cockpit-style" unified platforms versus custom-built dashboards for specific market pulses is real, and neither approach is universally superior. What matters is whether your setup eliminates friction.
That said, dashboards carry a genuine risk that most traders underestimate: over-reliance. When all your data appears in one place, it's tempting to treat it as gospel. Feed discrepancies between composite data and exchange-level data can produce misleading readings, so verification across sources remains critical even with the best dashboard.
Here's what separates a scalping-grade dashboard from a generic charting layout:
- Multi-timeframe (MTF) view: Displays trend context and entry signals simultaneously
- Real-time signal feed: Non-repainting buy/sell signals with clear confluence indicators
- Order flow and liquidity display: Shows where institutional money is moving
- Integrated alerts: Fires notifications the moment conditions are met
- Spread and execution monitor: Tracks broker-side conditions in real time
- Trade log module: Captures entries, exits, and notes for post-session review
If you want to see how MTF integration works in practice, the MTF Scalping Dashboard breakdown shows exactly how layering timeframes sharpens entry timing.
| Feature | Isolated indicators | Scalping dashboard |
|---|---|---|
| Context switching | High | Minimal |
| Signal confluence | Manual | Automated |
| Execution speed | Slower | Faster |
| Data verification | Difficult | Centralized |
| Post-trade review | Separate tool needed | Built-in |
Core components of a scalping dashboard
Understanding the definition, let's dig deeper into the essential components every serious scalping dashboard should have. Not every dashboard is built the same, and the gap between a generic multi-chart layout and a purpose-built scalping environment is enormous.
Dashboards excel for scalpers by reducing context-switching and enabling confluence detection, but success requires broker optimization, multi-source verification, and integration with journaling for iterative improvement. That's a lot to pack in, so here's how each component contributes:
- Multi-timeframe chart integration: You need to see the 15-minute trend and the 1-minute entry signal at the same time. Without this, you're flying blind on trend context.
- Real-time order flow display: Showing bid/ask depth, large order clusters, and absorption zones lets you anticipate moves before they happen rather than chasing price.
- Signal confluence panel: A module that aggregates multiple indicator signals (momentum, volume, trend) and flags when they align. This is where edge is actually built.
- Integrated alert system: Alerts that fire directly to your screen or via webhook to Discord mean you never miss a setup because you blinked.
- Trade journaling module: Logging trades inside the dashboard, rather than in a separate spreadsheet, makes post-session analysis faster and more honest.
- Broker connection layer: Direct integration with your broker or exchange for one-click execution eliminates the fatal delay of switching platforms at the moment of entry.
For a broader look at which indicators pair best with dashboard setups, the scalping indicators overview covers the most effective tools across different asset classes. If you're focused on intraday crypto or forex, the intraday scalping tools guide goes deeper on timeframe-specific setups.
Pro Tip: When evaluating any dashboard, prioritize customizable modules over a fixed layout. Your workflow for scalping EUR/USD on a 1-minute chart looks nothing like a crypto trader working 3-minute BTC setups. One-size-fits-all dashboards create friction instead of removing it.
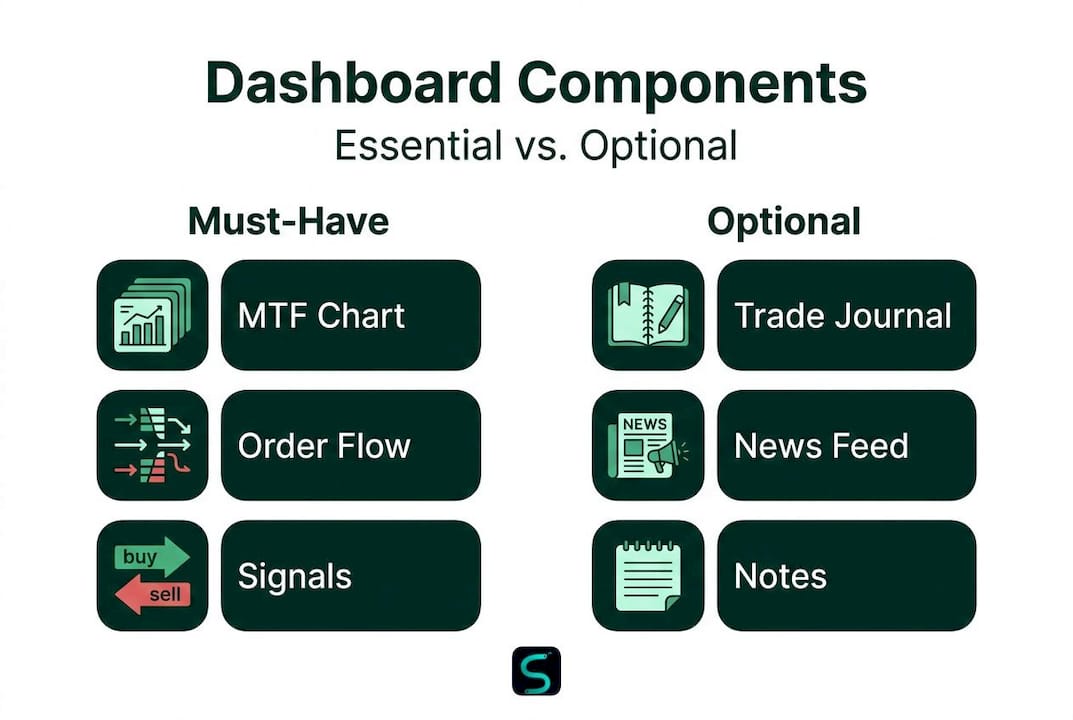
| Dashboard module | Must-have | Optional |
|---|---|---|
| MTF chart view | Yes | |
| Order flow display | Yes | |
| Signal confluence panel | Yes | |
| Integrated alerts | Yes | |
| Trade journaling | Yes | |
| News feed integration | Yes | |
| Sentiment tracker | Yes | |
| Custom scripting support | Yes |
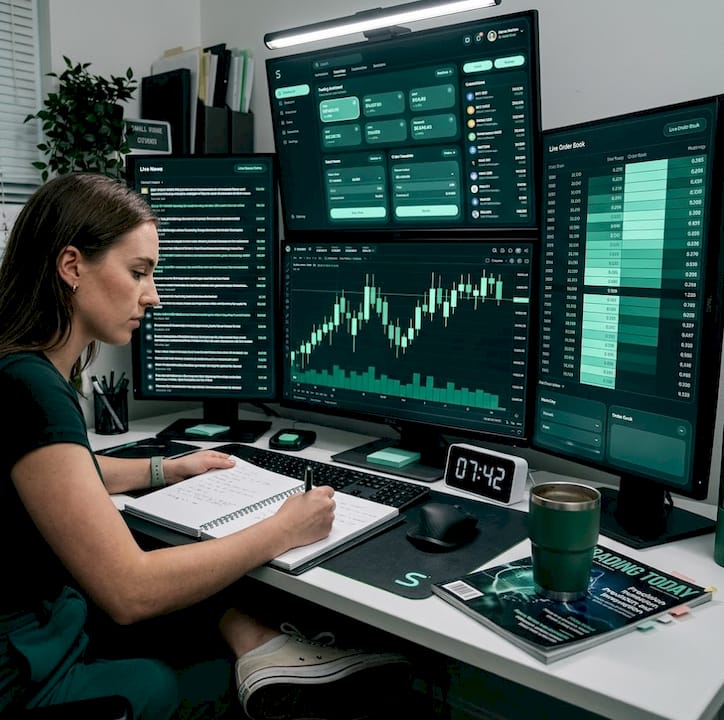
How trading dashboards empower scalpers
With all these components in place, what does a dashboard really change for your day-to-day scalping results? The honest answer: more than most traders expect.
The biggest gain is speed. Dashboards reduce context-switching and enable confluence detection, which directly translates to faster, more confident entries. In scalping, a two-second delay between spotting a signal and executing a trade can be the difference between a clean fill and a terrible one. Dashboards don't just look cleaner. They make you faster.
Confluence detection is the second major advantage. Most retail scalpers know they should wait for multiple signals to align before entering, but doing that manually across separate windows is genuinely hard. A dashboard that automatically highlights when your momentum indicator, volume spike, and price action pattern all agree at the same moment removes the guesswork entirely. You see the confluence, you act. That's it.
Here's what a dashboard-driven workflow actually improves:
- Entry timing: Signals appear in context, so you're not second-guessing trend direction
- Risk management: Spread monitors and volatility gates prevent entries in unfavorable conditions
- Discipline: Seeing all your rules in one place makes it easier to follow them
- Post-trade learning: Journaling built into the dashboard means you review every trade in context, not in isolation
The journaling piece is underrated. When you can replay a session and see exactly what the dashboard was showing at the moment you entered or exited, patterns emerge fast. You start recognizing which confluence setups actually work for your style and which ones are noise.
Pro Tip: Use your dashboard's alert and notes module to tag your trades in real time. Write one sentence about why you took the trade as you take it. When you review later, you'll reverse-engineer your best setups and identify the emotional mistakes that cost you money.
For traders who want to sharpen their edge detection further, the edge detection tools breakdown shows how algorithmic edge-finding layers into a dashboard workflow. The smart scalping signals indicator is a strong example of how real-time, non-repainting signals can anchor a dashboard's signal feed.
Common pitfalls and how to avoid dashboard traps
Just as dashboards offer advantages, they also bring their own set of pitfalls you must avoid to stay competitive. The most dangerous assumption in trading is that a clean, well-designed interface means accurate data.
Edge cases in dashboard use include data latency during high volatility (such as WebSocket reconnects in real-time apps), regime transition lags where signals conflict, low liquidity causing wide spreads or fake volume, correlation breakdowns, and discrepancies between composite feeds and exchange-level data that produce false signals. These aren't theoretical problems. They happen regularly during news events, market opens, and thin overnight sessions.
"A dashboard that shows you everything can also mislead you about everything. The data is only as reliable as the feed behind it."
Here's how to protect yourself:
- Cross-check your feed: Never rely on a single data source for order flow or volume. Compare your dashboard reading against a second source before acting on unusual spikes.
- Watch for latency flags: If your dashboard has a connection status indicator, watch it. A lagging feed during a fast move is worse than no feed at all.
- Treat volume spikes with skepticism: Fake liquidity and spoofed order book levels are common in crypto markets. A sudden volume spike that doesn't result in price movement is a warning sign.
- Know your market regime: Dashboards built for trending markets can produce conflicting signals during choppy, low-volatility sessions. Recognize when your setup's signals are unreliable.
- Test before you trust: Run any new dashboard in paper trading mode for at least two weeks across different market conditions before using it live.
For a detailed walkthrough of setting up an indicator-based dashboard correctly, the algo indicator setup guide covers the configuration steps that most traders skip.
How to choose or build the right trading dashboard
Armed with what works and what to watch out for, how do you choose or create a dashboard that genuinely boosts your scalping performance? The answer starts with an honest assessment of your own workflow, not with a feature comparison list.
Professional platforms like Quantower and cTrader offer unified cockpit-style environments with deep broker integration, while custom-built solutions using Python or Streamlit let you build exactly what you need for a specific market pulse. TradingView scripts sit in the middle: highly accessible, easily customized, and sufficient for most retail scalpers.
Here's a practical process for making the right choice:
- List your core tools: What indicators, timeframes, and data types do you actually use in every session? Start there.
- Identify your biggest friction point: Is it slow signal detection? Missing entries? Poor post-trade review? Your dashboard should solve your specific problem.
- Assess your technical skill: Custom builds offer maximum flexibility but require coding knowledge. If you're not comfortable with Python or Pine Script, a platform solution is smarter.
- Test broker compatibility: Your dashboard is useless if it can't connect cleanly to your execution layer. Confirm compatibility before committing.
- Run a structured test: Use the dashboard across at least 50 trades in real market conditions before judging its effectiveness.
| Approach | Best for | Limitations |
|---|---|---|
| TradingView scripts | Retail scalpers, crypto/forex | Limited broker integration |
| Quantower/cTrader | Active professionals | Higher learning curve |
| Custom Streamlit build | Developers, niche strategies | Time-intensive to build |
| Hybrid (TradingView + alerts) | Most retail scalpers | Requires manual execution |
For traders focused on ultra-fast entries, the 1-minute scalping setups guide shows how dashboard configuration differs at the lowest timeframes where every millisecond of latency matters.
Why mastery of dashboards matters more than dashboard choice
Here's the contrarian view that most dashboard reviews won't give you: the dashboard itself is almost never the reason traders succeed or fail. The process behind the dashboard is.
Every month, traders upgrade to a more expensive platform, add more modules, and tweak their layouts, expecting results to improve automatically. They rarely do. The traders who actually get better are the ones who use their dashboard to build a repeatable, reviewable process. They journal every trade. They cross-check their data. They notice when their setup stops working in a changed market regime and adapt before it costs them.
The uncomfortable truth is that a disciplined scalper with a basic TradingView layout and a solid journaling habit will outperform a sloppy trader with a $500-a-month institutional platform. Tools amplify your process. They don't replace it.
Multi-source verification and consistent post-trade review are the habits that separate profitable scalpers from the rest. No dashboard feature substitutes for the discipline of checking your signals against a second source before a major trade, or reviewing your session notes every evening. If you want to build those habits alongside better tools, scalping performance tips covers the workflow practices that actually move the needle.
Choose your dashboard based on fit, not hype. Master the process before you upgrade the tool.
Take your scalping to the next level with pro-grade dashboards
If this guide has shown you anything, it's that the right dashboard setup can fundamentally change how fast and how accurately you trade. But knowing what a great dashboard looks like and actually having one are two different things.
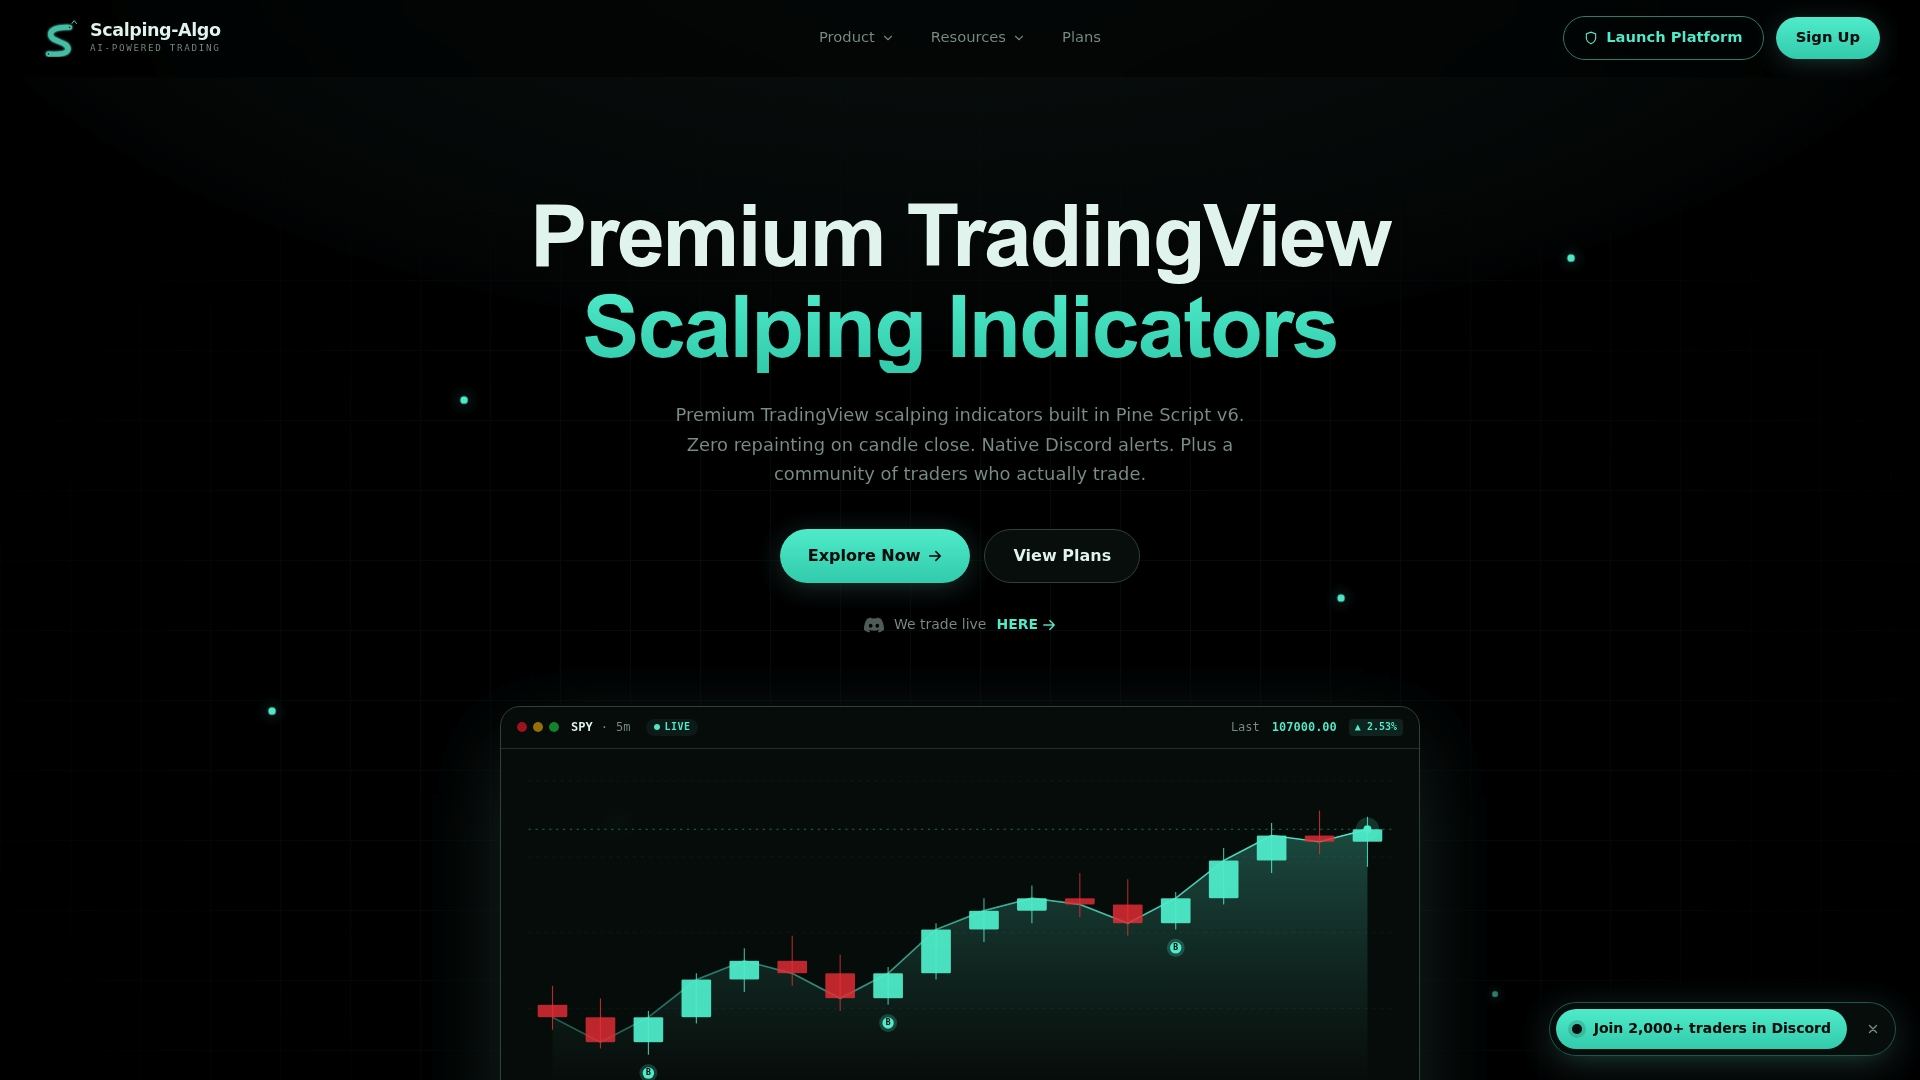
At Scalping-Algo, we've built exactly the kind of pro-grade environment this article describes. The scalping dashboard suite integrates real-time non-repainting signals, multi-timeframe confluence tools, volatility gating, and native webhook alerts into a single Command Center built for retail scalpers. Every module is customizable, every script is open-source, and the Discord community gives you live mentorship alongside the tools. Explore the full range of premium scalping indicators and see how institutional-grade technology can fit a retail trader's workflow.
Frequently asked questions
What is the primary benefit of a trading dashboard for scalpers?
A trading dashboard lets scalpers react faster by unifying key signals and order flow in one place, reducing context-switching and enabling faster confluence detection that isolated charts simply can't match.
How can dashboard data latency impact trading outcomes?
Data latency during volatility can cause your dashboard to display stale prices or false signals at exactly the worst moment, so cross-checking against a secondary source before acting on unusual readings is essential.
Should I build my own dashboard or use a ready-made platform?
Choose based on your technical skill and workflow needs: custom builds using tools like Streamlit offer maximum flexibility, while professional platforms like Quantower and TradingView scripts provide reliable, accessible starting points for most retail scalpers.
What is the role of multi-source verification in dashboard use?
Multi-source verification protects you from acting on feed discrepancies or composite data errors that can make a dashboard show false arbitrage signals or misleading volume spikes, particularly during high-volatility sessions.