
Every scalper has been there: a shiny new indicator works flawlessly for two weeks, then blows up your account on week three. The frustrating truth is that no single indicator is always reliable across every market, timeframe, or asset. Reliability isn't a fixed property baked into a tool. It's a dynamic relationship between the indicator, the market regime, and how you deploy it. This article breaks down exactly what reliability means for scalpers, why it's so elusive, what kills it on low timeframes, and how to systematically improve it so you stop chasing the next great tool and start building a process that actually holds up.
Table of Contents
- What does indicator reliability actually mean?
- Why no single indicator is always reliable
- Challenges to indicator reliability in scalping
- How to improve indicator reliability for scalping
- The uncomfortable truth about indicator reliability in real markets
- Next steps: Reliable scalping tools and further resources
- Frequently asked questions
Key Takeaways
| Point | Details |
|---|---|
| No universal best indicator | No single tool is reliable for all assets, timeframes, or market conditions. |
| Context matters most | Indicator performance changes with market type, trading session, and asset volatility. |
| Testing and discipline needed | Reliability increases with careful parameter tuning, backtesting, and strict risk management. |
| Costs can erode edge | Transaction fees and slippage must be included when evaluating a strategy's real-world effectiveness. |
| No shortcuts to success | Ongoing learning, adaptability, and robust processes are key for consistent trading results. |
What does indicator reliability actually mean?
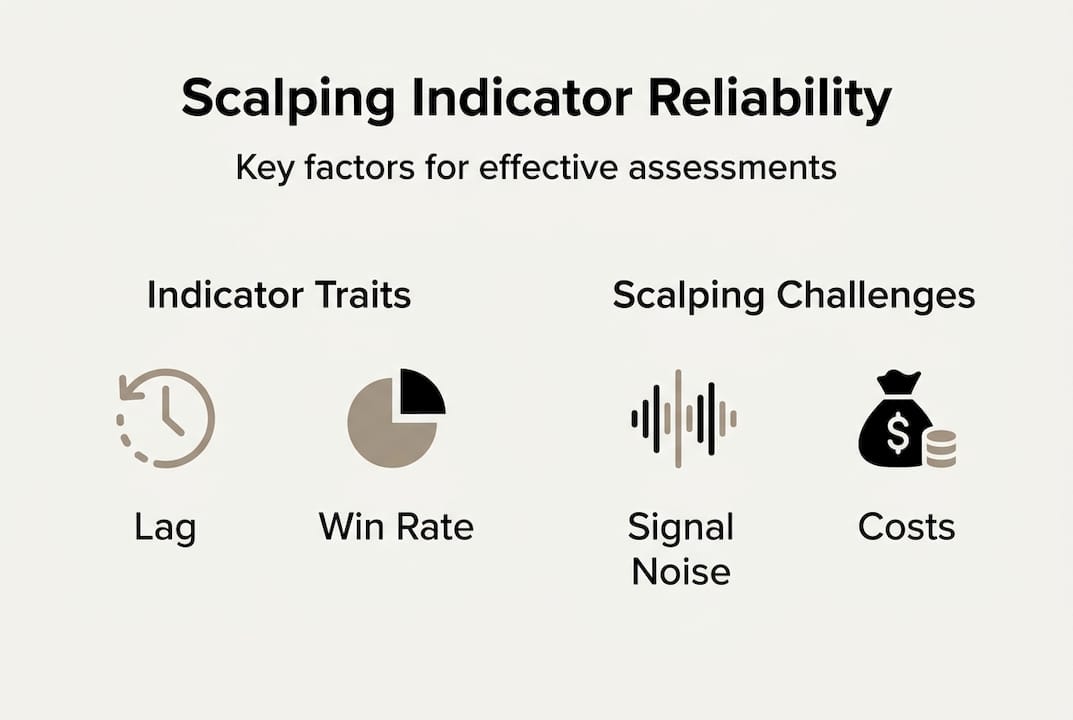
Most traders use the word "reliable" loosely. They mean: "This thing gives me winning trades." But that definition is too vague to be useful. For scalpers, reliability has several measurable dimensions worth separating.
Win rate is the percentage of trades that close profitably. A 55% win rate sounds solid, but if your losing trades are twice the size of your winners, you're still losing money. Drawdown measures how far your equity drops from a peak before recovering. High drawdown means the indicator fires false signals in clusters, which is especially punishing when you're operating on 1-minute or 5-minute candles.
Lag is the delay between a real market move and when your indicator reacts to it. Exponential moving averages (EMAs) react faster than simple moving averages (SMAs) because they weight recent prices more heavily. Oscillators like RSI (Relative Strength Index, which measures momentum on a 0 to 100 scale) are even more lag-prone at low timeframes because they smooth data across a look-back window.
Then there's noise sensitivity. On a 1-minute chart, price ticks up and down constantly. Indicators tuned for daily charts will fire constantly on that data, producing dozens of false signals per session. As scalping indicators often show, lag, noise sensitivity, and false signals are the defining problems on low timeframes.
Here's what to look for when evaluating whether an indicator is worth testing for your scalping setup:
- Documented win rate and drawdown across multiple market conditions
- Non-repainting signals (signals that don't change after the candle closes)
- Tested on out-of-sample data, not just the period it was built on
- Clear logic behind signal generation, not just curve-fitting
- Compatibility with your specific timeframe and asset class
"Reliability is not about how good an indicator looks on a chart. It's about how consistently it performs on data it has never seen before."
For a deeper look at how these principles apply in practice, the best TradingView indicator for scalping framework breaks down exactly what separates signal quality from visual noise.
Why no single indicator is always reliable
Defining reliability leads naturally to a harder question: do some indicators consistently outperform? The honest answer, backed by research, is no.

Empirical backtests across US ETFs found that Stochastic outperformed a buy-and-hold approach by just 0.28% in annual return (6.29% vs 6.01%), and only in 45% of cases. RSI actually underperformed. These are not rounding errors. They represent the core problem: indicators are regime-dependent.
Regime dependence means an indicator performs differently depending on whether the market is trending, ranging, or experiencing a volatility spike. An EMA crossover strategy thrives in a clean uptrend and gets destroyed in a choppy sideways market. RSI divergence shines in mean-reverting conditions but produces false positives when price is momentum-driven. Meta-analyses confirm 56% profitability for technical analysis before costs, dropping sharply after costs, with moving average crossovers specifically flagged as regime-dependent.
Here's a simplified comparison of how common indicators behave across conditions:
| Indicator | Trending market | Ranging market | High volatility | Low timeframe noise |
|---|---|---|---|---|
| EMA crossover | Strong | Weak | Variable | High false signals |
| SMA crossover | Moderate | Weak | Poor | Very high lag |
| RSI | Moderate | Strong | Poor | Very noisy |
| Stochastic | Moderate | Strong | Poor | Moderate noise |
The table makes the pattern obvious: no single row is green across the board. Every indicator has a home environment where it earns its keep, and markets that punish it hard.
For specific context on how this affects reversal setups, reversal indicator reliability is worth studying before committing to any single tool. You can also cross-reference day trading indicator insights to see how these dynamics shift across timeframes.
Pro Tip: Combining two non-redundant indicators (for example, a trend filter like EMA and a momentum oscillator like Stochastic) can filter noise more effectively than using either alone. Just be aware that adding more indicators also adds more conditions that must align, which reduces signal frequency and increases the risk of overfitting your setup to historical data.
Challenges to indicator reliability in scalping
Scalping is not just a faster version of swing trading. It operates in a fundamentally different environment where the same indicators behave in ways that longer-timeframe traders rarely encounter.
The first issue is raw signal frequency. On a 1-minute chart, an RSI with a 14-period setting generates dozens of overbought or oversold readings per day. Most of them go nowhere. The signal-to-noise ratio is terrible compared to what that same RSI produces on a daily chart. Daily timeframes outperform hourly for most strategies, with win rates of 39.7% versus 33.6% and meaningfully lower drawdowns at the daily level.
Here's a comparison of scalping versus longer timeframe reliability metrics:
| Metric | 1m to 5m scalping | H1 timeframe | Daily timeframe |
|---|---|---|---|
| Avg win rate | 28 to 35% | 33.6% | 39.7% |
| False signal rate | Very high | Moderate | Low |
| Drawdown risk | High | Moderate | Lower |
| Cost sensitivity | Extreme | Moderate | Low |
Beyond noise, transaction costs and slippage destroy scalping edges that look attractive before execution. If your indicator generates a 0.15% edge per trade but your average spread plus slippage costs 0.12%, you're left with almost nothing before accounting for variance. High-frequency mean-reversion strategies are frequently unprofitable once real-world frictions are applied.
Here are the main obstacles scalpers face when trying to build reliable indicator setups:
- Overfitting: Tuning parameters to look perfect on past data, then watching them fail forward
- Look-ahead bias: Accidentally using data in testing that wouldn't have been available in real-time
- Slippage: The difference between signal price and actual fill price, especially on fast-moving assets
- Spread costs: Particularly punishing on crypto pairs with low liquidity
- Indicator repainting: Signals that visually appear early but are recalculated after the fact
For asset-specific context on this problem, the breakdown of e-mini S&P 500 scalping challenges is particularly useful. And if you're weighing whether upgraded tools are worth the cost, are paid indicators worth it addresses that question directly.
Pro Tip: Always simulate your strategy with realistic transaction costs before going live. Use your broker's actual spread data, not theoretical mid-price fills. A strategy with a 55% win rate at mid-price can easily become a 44% win rate at real fills.
How to improve indicator reliability for scalping
Knowing the challenges, here's how to actually build more reliable setups rather than just diagnosing what breaks them.
-
Optimize parameters with purpose. Default settings (RSI 14, EMA 9/21) are not optimized for your specific asset or timeframe. RSI and EMA parameter optimization through delayed signal execution and adjusted look-back windows statistically improves returns. The key is optimizing on one data set and validating on a separate, untouched set.
-
Use walk-forward validation. This involves optimizing parameters on a rolling window of historical data, then testing each iteration on the next period forward. It's far more honest than simple backtesting and directly tests how well a strategy adapts to changing conditions.
-
Run out-of-sample tests. Split your historical data. Build on the first 70%, test on the last 30%. If performance collapses on the test set, the strategy is overfit.
-
Use multiple confirmation layers. A well-tuned buy and sell signal that requires agreement from a trend filter, momentum oscillator, and volatility gate will produce fewer signals but those signals carry substantially more weight.
-
Keep a detailed trading journal. Log every parameter change, the reason for it, and the measurable result on real data going forward. This prevents the common trap of tweaking blindly after a losing streak.
For ongoing learning, platforms like TradingView and QuantConnect offer free backtesting environments where you can test setups without risking capital. Pairing those tools with purpose-built indicators like smart scalping signals gives you both the infrastructure and the signal logic in one place.
Pro Tip: Keep a trading journal logging every tweak and its result on real data. Traders who journal are significantly less likely to fall into the overfitting trap because the record of failed optimizations is right there in front of them.
The uncomfortable truth about indicator reliability in real markets
Here's what most trading content won't say directly: the biggest threat to your indicator reliability isn't your settings. It's your behavior around those settings.
Most retail scalpers cycle through tools constantly, searching for the one that finally "clicks." This is indicator-hopping, and it's a feedback loop that prevents you from ever accumulating enough forward-test data to know if anything actually works. You optimize, it fails for two weeks, you switch. Repeat indefinitely.
The efficient market hypothesis, even in its weak form, suggests past prices alone have limited predictive power. Indicators don't create edge out of nothing. They organize information you already have. The edge, if it exists, comes from how you apply and adapt that information, not from the indicator itself.
What actually separates consistently profitable scalpers isn't the tool, it's the process. Disciplined testing, honest journaling, quick adaptation when a regime shifts, and ruthless cost accounting. A trader using three well-understood indicators with a strict testing protocol will outperform someone running fifteen indicators with no validation framework, every single time.
The Algo Master approach we use is built on exactly this principle: fewer, better-tested signals with clear logic and adaptive parameters, not a maximalist indicator stack that looks impressive but overfits to every historical chart.
Next steps: Reliable scalping tools and further resources
If you're ready to put this into practice with evidence-based tools, the path forward is simpler than most traders expect.
At Scalping-Algo, the full suite of premium scalping indicators is built in Pine Script v6, non-repainting by design, and optimized for low timeframes from 1m to 15m across crypto, forex, indices, and futures. Every tool ships with documented signal logic, backtesting access through the Command Center, and a Discord community where you can watch signals fire in real-time sessions. The Algo Master trading suite combines trend filtering, momentum confirmation, and volatility gating into a single tested framework, exactly what this article describes as the reliable approach. Start with a trial, test it on your preferred asset, and let the data guide the decision.
Frequently asked questions
Which trading indicator is most reliable for scalping?
No single indicator is always most reliable; performance depends on the market, timeframe, and how it's combined with other signals.
How do trading costs impact indicator reliability?
Transaction costs and slippage often turn seemingly profitable scalping strategies unprofitable once real-world frictions are applied to the results.
Can indicator reliability be improved with automation?
Automation enforces discipline, reduces emotional decision-making, and executes at signal price with consistent risk limits, all of which improve real-world reliability compared to manual execution.
What's the best way to test trading indicator reliability?
Walk-forward validation combined with out-of-sample backtesting and a consistent trading journal gives you the most accurate picture of how a setup will perform on live markets.