

Most traders assume momentum indicators tell you where price is going. They don't. That's the misconception that burns beginners the most. Explaining momentum indicators correctly means starting with this: they measure the speed and strength of price movement, not direction. Think of them as a speedometer, not a GPS. This guide covers the core oscillators you'll encounter in crypto, forex, and other markets, including RSI, MACD, Stochastic, ADX, and ROC, plus how to read their signals, avoid common traps, and build practical momentum indicator strategies that actually hold up.
Table of Contents
- Key takeaways
- Explaining momentum indicators from the ground up
- The five core oscillators every trader should know
- How to read momentum signals correctly
- Common mistakes when combining momentum indicators
- Applying momentum indicators in real markets
- My honest take on momentum indicators
- Take your momentum trading further with Scalping-Algo
- FAQ
Key takeaways
| Point | Details |
|---|---|
| Momentum measures speed | These tools track how fast price is changing, not which way it will go next. |
| Divergence signals caution | When price and momentum move in opposite directions, it signals weakening participation, not a guaranteed reversal. |
| Avoid the redundancy trap | Stacking RSI, MACD, and Stochastic together adds little new information and creates false confidence. |
| ADX filters signal quality | Pairing any momentum oscillator with ADX tells you whether you're in a trending or ranging environment. |
| Standard periods first | Start with default lookback periods (10 or 14) before adjusting, especially in volatile markets like crypto. |
Explaining momentum indicators from the ground up
The formal term for what most traders call "momentum indicators" is momentum oscillators. The distinction matters. An oscillator is a bounded or centered calculation that fluctuates around a reference point, usually zero or a midline. That oscillating behavior is what makes these tools readable at a glance.
Here's the core concept: momentum measures rate of price change, not price direction. If Bitcoin moves from $60,000 to $70,000 in two days, that's fast momentum. If it takes two months to make the same move, momentum is slow. The oscillator captures that difference numerically.
Momentum oscillators differ from trend indicators like moving averages. A moving average smooths price and shows direction. A momentum oscillator shows how quickly price is arriving at its current level. Both are useful. They measure different things.
Key structural features of momentum oscillators:
- Lookback period: How many bars are used in the calculation. The standard is 10 or 14 periods. Shorter periods react faster but produce more noise.
- Zero line or midline: Many oscillators use zero (ROC, MACD histogram) or 50 (RSI) as a dividing line. Values above signal bullish momentum; values below signal bearish.
- Bounded vs. unbounded: RSI and Stochastic are capped between 0 and 100. MACD and ROC are unbounded and expand or contract with volatility.
Understanding this structure gives you a real edge. Most beginners skip it entirely and jump straight to the buy/sell arrows.
The five core oscillators every trader should know
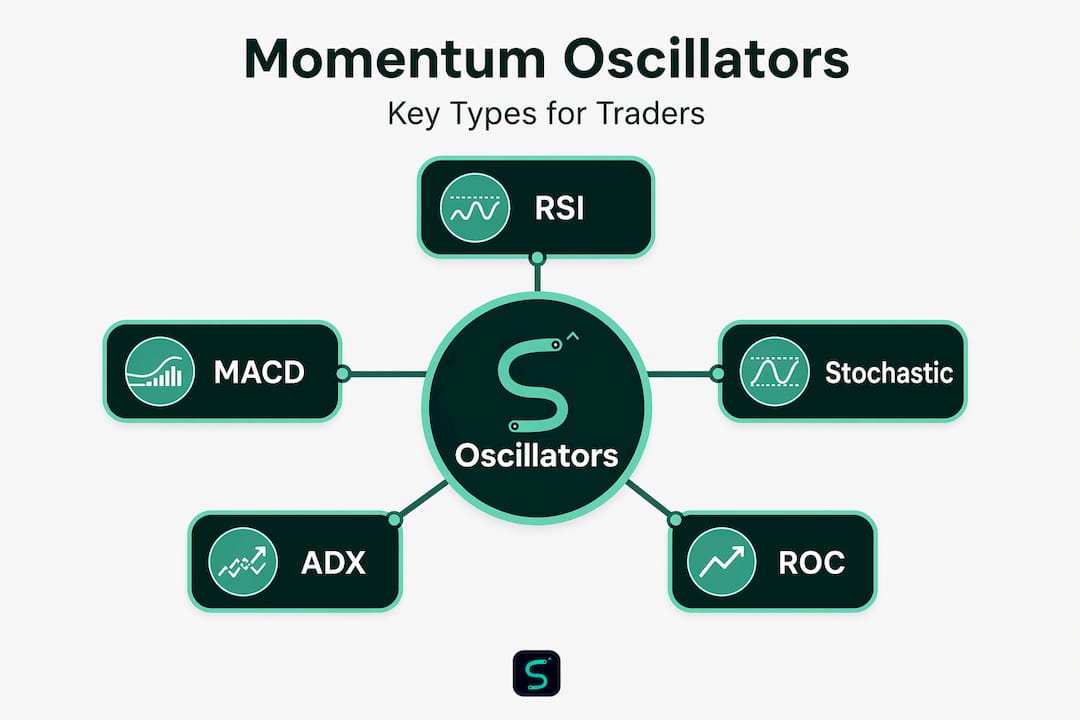
Each of these tools measures momentum from a slightly different angle. Here's how they work and what makes each one distinct.
| Indicator | Range | Key Signal | Best Use |
|---|---|---|---|
| RSI | 0–100 | Overbought (>70), Oversold (<30) | Divergence, momentum quality |
| MACD | Unbounded | Line crossovers, histogram shrinkage | Momentum shifts, trend timing |
| Stochastic | 0–100 | Overbought (>80), Oversold (<20) | Short-term reversals, ranging markets |
| ADX | 0–100 | Above 25 = strong trend | Trend strength filter |
| ROC | Unbounded | Zero-line crossings | Raw momentum direction |
RSI (Relative Strength Index) compares average gains to average losses over 14 periods, producing a 0 to 100 score. Readings above 70 are considered overbought; below 30, oversold. More on why those labels are misleading than helpful in the next section.

MACD (Moving Average Convergence Divergence) uses a 12-day and 26-day EMA to produce the MACD line, then plots a 9-period signal line on top. The histogram shows the gap between those two lines. When the histogram shrinks, momentum is decelerating. That's often the first warning before price confirms a change.
Stochastic Oscillator takes a different approach. Instead of comparing gains to losses, it measures where the close sits relative to the recent high-low range. An 80 reading means the close is near the top of the 14-period range; 20 means it's near the bottom. In a strong uptrend, price can stay above 80 for extended periods without reversing. That's a feature, not a glitch.
ADX (Average Directional Index) is unique because it doesn't tell you direction at all. It measures trend strength non-directionally. Values above 25 indicate a strong trend is in place; below 20 suggests price is in a ranging, directionless environment. This distinction changes how you interpret every other oscillator on your chart.
ROC (Rate of Change) is the most literal momentum tool. It calculates percentage price change over a set period and plots it around a zero line. Cross above zero, bullish momentum. Cross below, bearish. Recommended lookbacks are 10 or 14 periods to keep it clean. A momentum oscillator on TradingView built on these principles can make zero-line behavior much easier to track visually.
How to read momentum signals correctly
This is where most traders go wrong. Understanding momentum indicators at a surface level is easy. Reading them accurately under real market conditions takes more nuance.
Overbought and oversold are not reversal calls. When RSI hits 75, that does not mean price is about to drop. In a strong uptrend, RSI can sit above 70 for weeks. Beginners often misinterpret these zones as automatic sell signals and get stopped out of perfectly good trends. The labels are describing conditions, not commands.
Divergence is your most reliable signal. Bullish divergence occurs when price makes a lower low but the oscillator makes a higher low. That gap shows that selling pressure is weakening even as price slides. Bearish divergence is the reverse. Price makes a higher high; the oscillator does not. The Scalping-Algo divergence indicator is purpose-built to detect this automatically across timeframes.
- Bullish divergence: Price lower low + oscillator higher low = weakening selling pressure
- Bearish divergence: Price higher high + oscillator lower high = weakening buying pressure
- Hidden bullish divergence: Price higher low + oscillator lower low = trend continuation signal
- Hidden bearish divergence: Price lower high + oscillator higher high = bearish continuation
MACD histogram as early warning. Most traders watch for the MACD line to cross the signal line. That's a lagging event. Watching the histogram shrink gives you the signal earlier. When the histogram peaks and starts contracting, momentum is fading before the crossover confirms it.
ADX as your environment filter. This is the move most beginners skip entirely. Before acting on any oscillator signal, check ADX thresholds. If ADX is above 25 and rising, you're in a trend regime. Momentum continuation signals are more reliable here. If ADX is below 20, you're ranging. Overbought/oversold levels become more meaningful.
Beyond the level itself, pay attention to slope and distance from zero. An indicator contracting toward zero even while still positive tells you momentum is weakening. Not reversing necessarily, but losing steam.
Pro Tip: Don't use divergence as a standalone entry trigger. Use it as a risk management flag. When you see bearish divergence in a crypto uptrend, consider tightening your stop rather than immediately shorting.
Common mistakes when combining momentum indicators
The redundancy trap is real, and it catches more traders than you'd expect. Stacking RSI, MACD, and Stochastic on the same chart looks like thorough analysis. In practice, combining correlated oscillators gives you the same information three times over. All three pull from price in similar ways. When they agree, it's not confirmation, it's echo.
Here's how to build a cleaner setup:
- Pick one momentum oscillator. RSI or Stochastic, not both. They measure closely related things.
- Add a trend tool. A moving average or the ADX itself. This tells you the market regime your momentum signal is operating in.
- Add a volatility layer. Bollinger Bands or ATR. Volatility affects how momentum signals behave. High volatility can make signals look stronger than they are.
- Avoid zero-line entries alone. Zero-line crossovers are not strong standalone trade signals. Use them with broader price structure context.
For indicator reliability in scalping, this principle is even more critical. On a 1-minute or 5-minute chart, noise multiplies fast. One clean oscillator with a trend filter outperforms a panel of five overlapping ones.
Pro Tip: Start with the standard lookback periods of 10 or 14 before experimenting. Shorter periods increase sensitivity but also false signals, especially in crypto where volatility is high.
Applying momentum indicators in real markets
Knowing how these tools work is half the job. Here's how to apply them practically across crypto, forex, and commodities.
-
Use momentum for entry timing, not prediction. Wait for price to reach a key level (support, resistance, a moving average). Then check the oscillator. If momentum is building in the direction of your trade, that's a higher-probability setup. If momentum is already fading at that level, wait.
-
Layer in volume confirmation. Momentum readings carry more weight when volume supports the move. A breakout with rising RSI and above-average volume is a materially stronger signal than price moving alone.
-
Adapt lookback periods to the market. Crypto moves fast. A 14-period RSI on a 1-minute Bitcoin chart updates constantly and can whipsaw. Some traders shorten to 9 periods for faster reaction, while forex traders on 4-hour charts often stick with 14. There's no universal setting.
-
Use the ADX regime approach. ADX rising above 25 is your green light for momentum continuation trades. ADX falling below 20 shifts your strategy toward mean reversion using overbought/oversold zones. This single filter changes how you interpret everything else on the chart.
-
Confirm signals with price structure. An RSI divergence near a documented support zone is meaningful. The same divergence in the middle of open space carries far less weight. Context is everything in momentum trading explained correctly.
The Scalping-Algo platform incorporates these principles directly into its indicators, with volatility gating and divergence detection built in to help you filter out low-quality signals automatically.
My honest take on momentum indicators
I've spent years watching traders load up their charts with RSI, MACD, Stochastic, Williams %R, and CCI all at once, waiting for every single one to agree before they trade. What they're actually doing is waiting for five instruments that measure nearly the same thing to align. The confirmation never comes, or it comes so late that the move is over.
My experience is that divergence works far better as a risk management tool than an entry trigger. When I see bearish divergence forming on a 15-minute chart, I don't automatically go short. I tighten my stop, reduce size, or stand aside until the structure confirms. That shift alone saved me from dozens of costly mistakes.
The ADX filter is the most underused trick in retail trading. Most traders completely ignore it. But trading a momentum signal without knowing whether you're in a trend or range is like checking wind speed without knowing if it's indoors or outside. The reading means something completely different.
If you're new to this, start simple. One oscillator, one trend filter, one volatility check. Practice it in a demo environment until you recognize how signals look in trending versus ranging conditions. Real pattern recognition takes repetition, not more indicators.
Momentum indicators measure speed. They don't predict the future. The faster you internalize that framing, the better your decisions will be.
— Tran
Take your momentum trading further with Scalping-Algo
If you want to apply these concepts without spending weeks building your own setup from scratch, Scalping-Algo has you covered.

The premium TradingView indicators at Scalping-Algo are built specifically for retail traders who want institutional-grade momentum tools without the complexity. Every indicator is non-repainting, open-source, and optimized for lower timeframes from 1-minute to 15-minute charts. The platform includes divergence detection, volatility gating, and ADX-based regime filtering built directly into the signal logic. If you want precise entries backed by tested momentum principles, the Smart Scalping Signals indicator is a strong starting point. Try it with the Discord community behind you for live support and mentorship.
FAQ
What are momentum indicators in trading?
Momentum indicators are oscillators that measure the speed and strength of price changes over a defined period. They do not predict direction but show whether buying or selling pressure is accelerating or fading.
What is the best momentum indicator for beginners?
RSI is the most beginner-friendly option because it is bounded between 0 and 100 and has clearly defined overbought and oversold levels. Pairing RSI with ADX helps beginners understand whether they are trading in a trend or range environment.
How do you use divergence in momentum trading?
Divergence occurs when price and an oscillator move in opposite directions. Bullish divergence signals weakening selling pressure; bearish divergence signals weakening buying pressure. Use divergence as a risk management flag, not a standalone trade entry.
Does using more momentum indicators improve accuracy?
No. Combining multiple oscillators like RSI, MACD, and Stochastic typically produces redundant signals because all three are derived from price in similar ways. One oscillator plus a trend filter and a volatility tool is more effective.
What lookback period should I use for momentum indicators?
Start with the standard 10 or 14 period settings before adjusting. Shorter lookbacks increase sensitivity but also noise, particularly in fast-moving markets like crypto.