

Lower timeframe charts are price charts displaying market data in short intervals, typically 1 minute to 15 minutes per bar, and they are the primary tool for scalpers and intraday traders. The industry standard defines anything below the 4-hour interval as a lower timeframe, with the 1-minute, 3-minute, 5-minute, and 15-minute charts being the most widely used. Understanding what are lower timeframe charts means recognizing their core trade-off: they deliver granular, moment-to-moment price action that enables precise entries and exits, but they also carry significantly more noise than daily or weekly charts. Scalping-algo builds its entire indicator suite around this reality, offering tools purpose-built for the 1-minute to 15-minute range.
What are lower timeframe charts and how do they differ from higher timeframes?
Lower timeframe charts are defined as any chart below the 4-hour interval, most commonly the 1-minute, 3-minute, 5-minute, and 15-minute bars. Higher timeframe charts, by contrast, include the 4-hour, daily, weekly, and monthly views. The difference is not just visual. Each timeframe type serves a distinct purpose in a trader's workflow.
The most important structural difference is signal frequency versus signal quality. Lower timeframe charts produce far more signals per session. That sounds like an advantage, but each additional signal also carries a higher probability of being noise rather than a genuine move. Higher timeframe charts filter out that noise naturally because each bar represents a longer period of price discovery.

The table below shows how the two categories compare across the metrics that matter most to short-term traders.
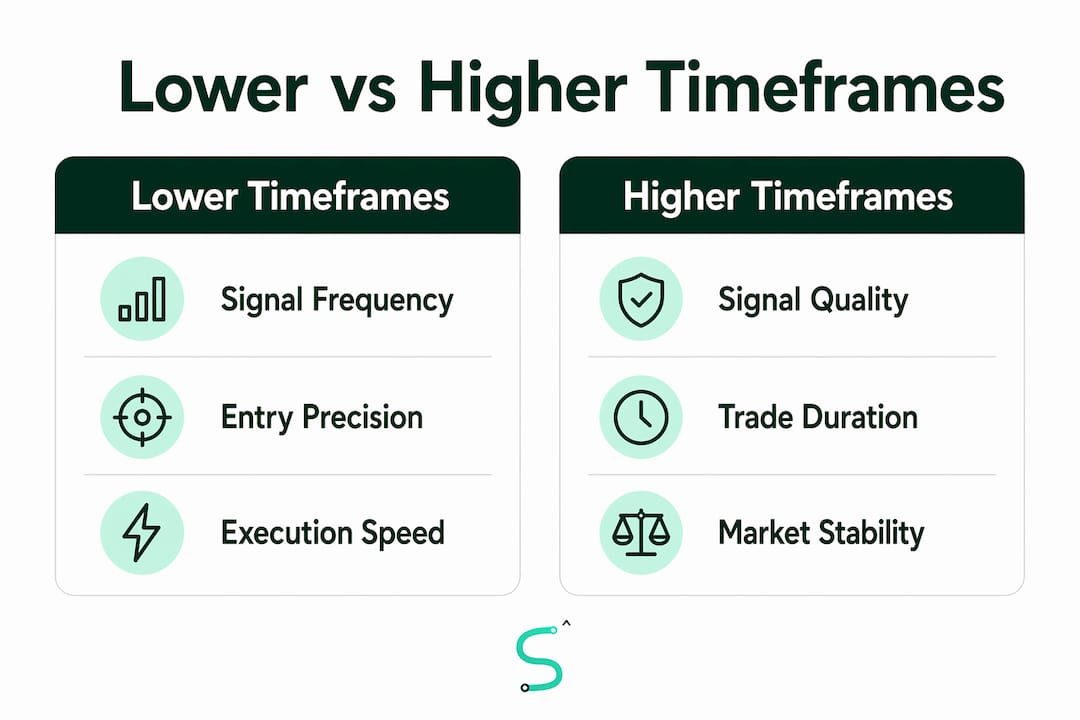
| Feature | Lower timeframes (1–15 min) | Higher timeframes (4H and above) |
|---|---|---|
| Signal frequency | Very high | Low to moderate |
| Noise level | High | Low |
| Typical user | Scalper, intraday trader | Swing trader, position trader |
| Decision speed required | Seconds to minutes | Hours to days |
| Execution cost sensitivity | High | Low |
| Trend clarity | Low | High |
Scalpers and intraday traders rely on lower timeframe charts because their holding periods are short. A scalper on a 1-minute chart may hold a trade for 3 to 12 minutes before exiting. That speed requires a chart that updates frequently enough to reflect real-time price changes. A swing trader holding for days has no use for that level of detail.
What are the benefits and challenges of lower timeframe trading?
Lower timeframe charts create more trading opportunities per session than any other chart type. A trader watching a 5-minute chart during a four-hour session can see dozens of potential setups where a daily chart trader might see one. That frequency is the primary draw for scalpers.
Benefits of lower timeframe analysis:
- More entry and exit opportunities per session
- Tighter stop-loss placement based on recent swing highs and lows
- Faster feedback on whether a trade is working
- Better precision for timing entries within a trend identified on a higher timeframe
- Smaller capital exposure per trade due to tighter targets
The challenges are just as real. Lower timeframe charts generate significantly more false signals compared to daily charts, and that directly increases emotional stress and execution costs. Every false signal is a potential losing trade, and losing trades on tight margins add up fast when spread and slippage eat into each position.
High-frequency signals compound execution costs like spread and slippage, which can destroy profitability on low-margin trades. This is why filtering matters more on lower timeframes than anywhere else. Traders who skip confirmation steps pay for it in their win rate.
Lower timeframe trading demands psychological resilience and strict discipline to avoid impulsive trades. The pace is relentless. Prices move fast, decisions happen in seconds, and a single emotional reaction can wipe out several good trades.
Pro Tip: Trade lower timeframe charts only during high-liquidity windows. The first 1 to 2 hours of the New York session and the London-New York overlap produce the cleanest price action. Avoid trading around scheduled news events, where spread widens and slippage spikes.
How do traders use lower timeframe charts within multi-timeframe analysis?
Multi-timeframe analysis is the standard framework for using lower timeframe charts effectively. The concept is straightforward: use higher timeframes to identify trend direction, then drop to lower timeframes to time the actual entry. Multi-timeframe analysis maintains a 4 to 6 times ratio between the trend timeframe and the execution timeframe to produce meaningful confirmation.
A practical three-layer structure works as follows:
- Daily chart (macro view). Identify the dominant trend direction. Is price making higher highs and higher lows, or the reverse? This is the only trade direction you take on lower timeframes.
- 1-hour chart (intermediate view). Look for structure within the daily trend. Identify key support and resistance levels, and watch for the price to pull back toward those zones.
- 5-minute or 15-minute chart (execution view). Wait for a trigger signal within the zone identified on the hourly chart. Enter only when the lower timeframe confirms the move.
This structure prevents the most common mistake in lower timeframe trading: taking every signal the chart produces without context. A buy signal on a 5-minute chart means very little if the daily trend is bearish.
Adapting daily strategies to lower timeframes requires parameter scaling and stacked confirmation filters. Simply copying a daily setup onto a 1-minute chart produces high false signal rates and poor results. Indicators need to be more responsive, and conditions need to stack before a trade is taken.
Stacked confirmation is the practical solution. Traders use conditions like price above VWAP, RSI below 30 for longs, and volume exceeding 1.5 times the rolling average, all required simultaneously on the lower timeframe before entering. Each condition alone is weak. Together, they filter out the majority of false signals.
Pro Tip: When you move from a daily strategy to a 5-minute chart, scale your stop and target symmetrically. If your daily stop is 50 points, your 5-minute stop should reflect the proportionally tighter range of that timeframe. Mismatched risk parameters are the fastest way to blow a lower timeframe account.
What scalping strategies work best on lower timeframe charts?
Scalping is the trading style most closely associated with lower timeframe charts. The goal is to capture small price moves repeatedly, with each trade lasting minutes rather than hours. The 1-minute scalping strategy is the most aggressive form, with typical trade durations of 3 to 12 minutes.
Common entry triggers on lower timeframe charts:
- EMA crossovers. A fast exponential moving average crossing above a slower one signals momentum in the direction of the cross. The 9 EMA crossing the 21 EMA on a 5-minute chart is a widely used trigger.
- Pullback entries. Price pulls back to a key level (VWAP, a prior high turned support, or a moving average) and shows a rejection candle. Entry is on the close of that rejection bar.
- Momentum triggers. RSI divergence or a volume spike confirms that a move has real participation behind it, not just random noise.
Scalping strategies use EMAs, pullbacks, and momentum triggers for entries, with stops placed just beyond recent swing highs or lows. The risk target is tight, designed to capture small moves before the market reverses.
Time stops are a critical risk management tool that most traders overlook. If a trade does not move favorably within 3 to 10 minutes, experienced scalpers exit regardless of whether the stop has been hit. This prevents capital from being locked in choppy, directionless price action.
The table below shows typical parameters for common lower timeframe scalping setups.
| Setup type | Timeframe | Typical hold time | Stop placement | Target |
|---|---|---|---|---|
| EMA crossover | 1-min, 5-min | 3–8 minutes | Below swing low | 1:1 to 1:2 R |
| Pullback to VWAP | 5-min, 15-min | 5–15 minutes | Below VWAP | 1:1.5 to 1:2 R |
| Momentum breakout | 1-min, 3-min | 2–6 minutes | Below breakout bar | 1:1 R |
Liquidity is the non-negotiable condition for all of these setups. Scalping on lower timeframe charts during low-volume periods produces wide spreads and erratic fills. The London-New York overlap and the first hour of the New York session are the two windows where conditions consistently support tight execution. Outside those windows, the edge shrinks fast.
Key Takeaways
Lower timeframe charts give traders more signals and tighter entries, but only disciplined filtering and multi-timeframe context convert that frequency into consistent profitability.
| Point | Details |
|---|---|
| Definition of lower timeframes | Charts below the 4-hour interval, typically 1-minute to 15-minute bars, used by scalpers and intraday traders. |
| Signal frequency vs. noise | More signals per session come with more false breakouts; filtering is required to protect win rate. |
| Multi-timeframe structure | Use daily for trend, hourly for structure, and 5-minute or 15-minute for entry timing. |
| Stacked confirmation | Combine VWAP, RSI, and volume conditions simultaneously to reduce false signals on lower timeframes. |
| Time stops | Exit any trade that does not move favorably within 3 to 10 minutes to prevent capital lock in choppy conditions. |
What traders get wrong about lower timeframe charts
The biggest misconception I see is that lower timeframes simply give you more opportunities. They do, technically. But more signals without better filters is not an advantage. It is a faster way to lose money. Most traders who fail on 1-minute or 5-minute charts are not failing because the timeframe is wrong. They are failing because they brought a daily chart mindset to a market that moves in seconds.
The second mistake is ignoring the emotional cost. Lower timeframe trading is genuinely exhausting. The pace forces decisions before your analytical brain can fully process what is happening. That is why rules matter more here than anywhere else. If you do not have a written entry checklist before you sit down to trade a 5-minute chart, you are trading on instinct, and instinct loses to noise every time.
What actually works is the combination of top-down context and adaptive indicators. When you know the daily trend, the hourly structure, and you have a stacked confirmation signal on the 5-minute chart, the trade feels different. It is not a guess. It is a confluence. Beginners should spend at least a month reading lower timeframe charts without trading them, just to understand how price behaves at that speed. The patterns are real, but they require calibration that only screen time provides.
— Tran
Scalping-algo tools for lower timeframe trading
Scalping-algo builds its indicator suite specifically for the 1-minute to 15-minute range, where execution speed and signal quality both matter. The premium TradingView indicators generate real-time, non-repainting buy and sell signals with built-in volatility gating and divergence detection, so you are not chasing noise.

The Algo Master suite integrates three indicators designed to work together across multiple timeframes, giving you trend context on higher charts and precise entry triggers on lower ones. Every script is open-source and built in Pine Script v6, with native webhook alerts that push signals directly to Discord. If you trade crypto, forex, indices, or futures on lower timeframe charts, Scalping-algo gives you the confirmation stack that separates clean setups from random noise.
FAQ
What is a lower timeframe in trading?
A lower timeframe is any chart interval below 4 hours, most commonly the 1-minute, 3-minute, 5-minute, and 15-minute charts. These are used by scalpers and intraday traders who hold positions for minutes rather than hours or days.
What are the best indicators for lower timeframe charts?
Exponential moving averages, VWAP, and RSI are the most widely used indicators on lower timeframe charts. Combining all three as stacked confirmation conditions significantly reduces false signals compared to using any single indicator alone.
How do I avoid false signals on lower timeframe charts?
Require multiple conditions to align before entering a trade, such as price above VWAP, RSI in an oversold zone, and volume above its rolling average. This stacked confirmation approach filters out the majority of noise-driven signals.
What is the best time to trade lower timeframe charts?
The London-New York overlap and the first 1 to 2 hours of the New York session produce the highest liquidity and tightest spreads. Trading lower timeframe charts outside these windows increases slippage and reduces signal reliability.
How does multi-timeframe analysis work with lower timeframe charts?
Multi-timeframe analysis uses the daily chart for trend direction, the 1-hour chart for structure and key levels, and the 5-minute or 15-minute chart for entry timing. The 4 to 6 times ratio between timeframes produces the most reliable confirmation across the three layers.