

For 1m–15m scalping on TradingView, the right support and resistance setup is a non-repainting, zone-based indicator with multi-timeframe confluence and webhook-ready Discord alerts. That combination is the baseline. Anything less creates backtest illusions or missed entries.
Three features to confirm before you spend a dollar:
- Non-repaint enforcement: Signals must lock at bar close. Any indicator that redraws prior signals invalidates every backtest you run on it.
- Webhook/Discord alert capability: You need real-time payloads routed to Discord or a dashboard. Manual chart-watching on 1m charts is not a workflow.
- Volatility gating for low timeframes: An ATR-based filter that suppresses signals during choppy, low-range conditions is the difference between a clean signal and noise.
Quick start: load the indicator on a paper account, enable webhook alerts to a test Discord channel, and run a 1–2 hour live-forward session before touching real capital.
Table of Contents
- What do support and resistance indicators actually detect?
- How do scalpers use S/R indicators on 1m–15m charts?
- Confirmation signals and common scalper mistakes
- How do you set up S/R indicators in Pine Script v6 on TradingView?
- How do you backtest and forward-validate S/R indicators?
- What does a real-time execution and alert workflow look like?
- What should you ask before buying a premium S/R indicator suite?
- Key Takeaways
- The part most traders skip
- Scalping-algo gives you every feature on that checklist
- Useful sources
What do support and resistance indicators actually detect?
These tools convert chart history into a map of probable liquidity zones. The outputs scalpers care about fall into four categories:
- Horizontal zones: Price areas where the market reversed or consolidated multiple times. The strongest ones align across timeframes.
- Order blocks: Clusters of candles before a sharp directional move, used as a proxy for institutional order placement.
- Pivot levels: Calculated highs and lows from prior sessions or bars, useful as mechanical reference points for stop placement.
- VWAP and volume-weighted bands: VWAP is widely used as an institutional execution benchmark; anchored VWAP variants mark dynamic S/R that updates intraday.
On 1m and 5m charts, auto-detection tools create excessive noise without order-flow confirmation. Most pivot detectors are reliable on daily charts but overfit on 5m charts, which is exactly why multi-timeframe anchoring matters. You anchor the zone on a higher timeframe, then refine the entry on the execution chart.
The deeper issue: chart-drawn levels are a hypothesis, not a fact. Auto-detected TradingView levels often miss a significant portion of DOM-confirmed defended levels on low timeframes. The indicator gives you a candidate. The order book tells you whether anyone is actually defending it.
How do scalpers use S/R indicators on 1m–15m charts?
The workflow is a sequence—not a checklist you run in any order.
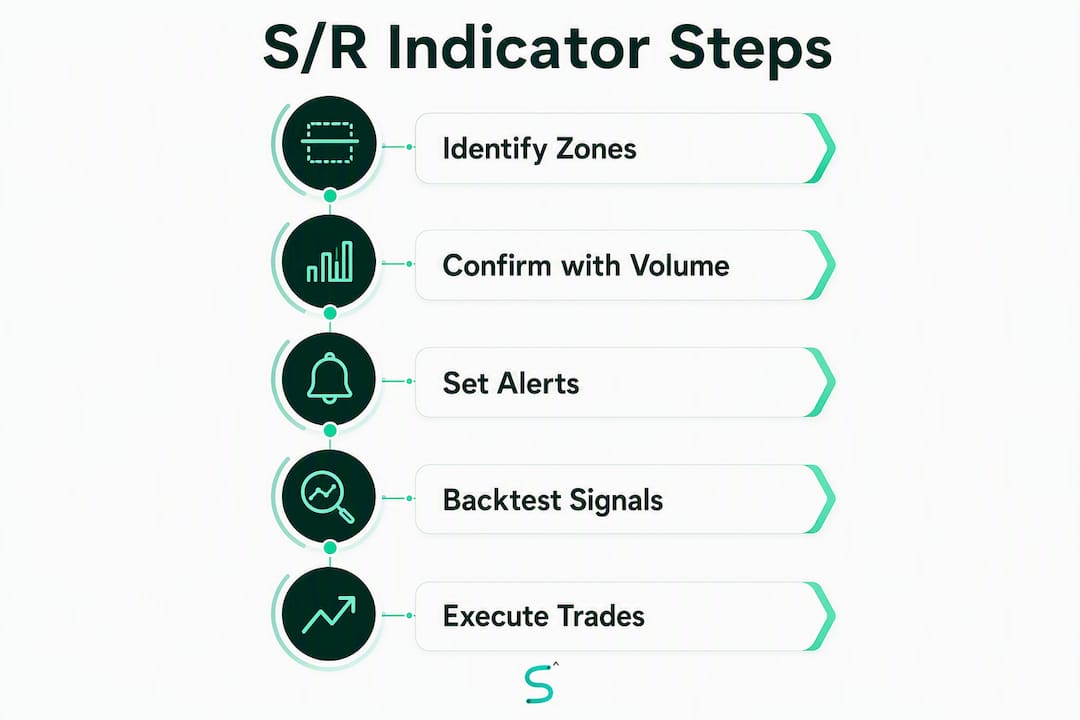
- Identify the higher-timeframe zone. Mark the 15m or 1H level first. This is your anchor. Use the multi-timeframe dashboard to surface these without manually switching charts.
- Refine on the execution timeframe. Drop to your 1m or 5m chart and find the micro-structure within that zone: a small consolidation, a wick cluster, or an order block.
- Set a volatility-gated entry. Only take the signal if the ATR filter confirms the market is in a tradeable range. Skip flat, compressed sessions.
- Confirm with volume or a Momentum Oscillator. A volume spike at the zone or a divergence signal on the Momentum Oscillator is your green light. No confirmation, no trade.
- Place a tight SL and staggered TPs. Stop goes just beyond the zone's invalidation point. First TP at the same risk level as the stop-loss, second at twice that risk level. ATR-based sizing keeps risk consistent across sessions.
Example: You spot a 15m support zone at $42,850 on BTC. Price pulls back to that zone on the 5m chart, forms a small inside bar, and the Momentum Oscillator shows bullish divergence. Volume spikes on the next candle. Entry triggers, SL sits 0.15% below the zone low, TP1 at 0.2% above entry. That is the full sequence.
Pro Tip: Limit yourself to 3–5 active zones per timeframe. More than that and you will find a "reason" to trade almost any candle, which is how edge disappears.

Confirmation signals and common scalper mistakes
Confirmations that actually matter
- Volume spike at the zone: A bar with above-average volume touching the level signals active participation, not passive drift.
- Momentum Oscillator divergence: Price makes a lower low but the oscillator makes a higher low at support. That divergence is a timing signal, not a guarantee.
- Micro-retest structure: Price breaks above a resistance zone, pulls back to test it as support, and holds. The retest candle closing above the zone is the entry trigger.
The mistakes that kill scalping edge
The most common error is treating a level as stronger because it has been tested multiple times. Each test of a support level consumes resting bids; experienced DOM traders treat frequent touches as level degradation, not confirmation. A level touched five times in two hours is often nearly exhausted.
Other mistakes:
- Drawing lines instead of zones. Price reacts to areas, not exact prices.
- Over-charting. Fifteen levels on a 5m chart means every candle is "near a level."
- Ignoring order-book context. A chart level with no DOM defense is a ghost.
Pro Tip: Watch the reaction size at each touch. If the first test bounced 15 ticks and the fourth test bounced 3 ticks, the level is weakening regardless of how clean it looks on the chart.
How do you set up S/R indicators in Pine Script v6 on TradingView?
Parameter tuning separates a useful indicator from a noisy one. Key settings to configure:
- Sensitivity/threshold: Controls how many historical bars the indicator scans to qualify a zone. Lower sensitivity on 1m charts reduces false zones.
- Zone width (%): Set as a percentage of price. Wider zones catch more reactions but produce wider stops.
- Multi-timeframe anchor: Lock the zone-detection logic to a higher timeframe (15m or 1H) while displaying on the execution chart.
- Non-repaint toggle: Confirm this is active. A signal must be immutable post-bar close to allow reliable backtesting and forward validation.
- ATR multiplier (volatility gate): Typical starting values are 1.0–1.5x ATR. Raise it during high-volatility sessions to reduce noise.
- Invalidation/refresh rules: Define when a zone is consumed and removed. A zone that price closes through by more than 0.1% should be invalidated automatically.
Practical presets: on 1m charts, use tighter zone widths and higher sensitivity thresholds. On 15m charts, widen the zone and lower sensitivity to catch broader institutional areas. Anchor levels to wicks on crypto (wicks often mark true liquidity sweeps) and to closes on equity index futures.
For Discord webhooks, your alert payload should include at minimum: symbol, timeframe, action (BUY/SELL), price, and zone ID. A debounce window of 1–2 bars prevents duplicate alerts from the same zone.
How do you backtest and forward-validate S/R indicators?
| Metric | What to measure | Pass threshold |
|---|---|---|
| Non-repaint verification | Compare live signals to locked historical signals | Zero discrepancies |
| Win rate by TP tier | TP1 hit rate vs. TP2 hit rate separately | TP1 hit rate should be above average on 1m/5m |
| Average R per trade | Net R across 50+ signals | Positive average R |
| Max drawdown per session | Worst consecutive loss sequence | Reasonably limited drawdown per session |
| Signal frequency per hour | Alerts fired per hour on target timeframe | Moderate alert frequency on 5m |
| False-signal clustering | Signals fired during flat/choppy conditions | Small proportion of total signals |
Non-repainting is the baseline requirement for 1m/5m usability. Run your backtest on locked historical signals, then run a short live-demo session of 1–5 market hours and compare the live webhook events to what the historical chart shows. Any divergence means the indicator is repainting. Check indicator reliability before scaling up.
What does a real-time execution and alert workflow look like?
The live workflow has five steps: signal fires → confirmation check → alert dispatched to Discord → execution decision → outcome logged.
Best practices for the alert layer:
- Use a dedicated test Discord channel for any new script. Verify payload formatting before routing to your live trading channel.
- Include zone ID in every payload so you can cross-reference the alert with the chart level that triggered it.
- Set a debounce window (1–2 bars) to prevent the same zone from firing multiple alerts on a single approach.
- Log every alert with timestamp and outcome. After 50 signals, review the log for false-signal patterns.
When to automate: high signal reliability across 100+ forward-tested signals, confirmed non-repaint behavior, and a defined R-per-trade expectation. Until then, use trading alerts for notifications and keep execution manual.
What should you ask before buying a premium S/R indicator suite?
- Can you prove non-repaint? Ask for a side-by-side of live signals vs. locked historical signals. No proof, no purchase.
- Are webhook payloads documented? A vendor who cannot show you a sample Discord payload has not tested their own alerts.
- Is volatility gating included? If the suite fires signals in flat markets without a filter, your win rate will suffer on low-volatility sessions.
- Does it include multi-timeframe confluence? Single-timeframe S/R indicators are incomplete for scalping.
- What are the recommended presets for 1m, 5m, and 15m? Vendors who have done the work will have specific starting parameters, not generic defaults.
- Is there a trial or demo period? Run 50–200 live-forward signals on a demo account before committing to a subscription. Compare signal frequency and R-per-trade to your benchmarks.
- Is there a community or mentorship channel? Active Discord communities catch edge cases and configuration errors faster than documentation alone.
Key Takeaways
Non-repainting signals, volatility gating, and webhook-ready alerts are the three non-negotiable features for any S/R indicator suite used on 1m–15m TradingView charts.
| Point | Details |
|---|---|
| Non-repaint is mandatory | Signals must lock at bar close; any repainting invalidates backtests and forward validation. |
| Limit active zones to 3–5 | More levels create noise and false confidence, not better entries. |
| Repeated touches weaken levels | Each test consumes resting liquidity; treat high touch counts as degradation, not strength. |
| Forward-test before subscribing | Run 50–200 live-demo signals and measure average R per trade before paying for a subscription. |
| Scalping-algo covers the full checklist | Non-repainting signals, Momentum Oscillator, volatility gating, Discord webhooks, and backtesting dashboard in one suite. |
The part most traders skip
The conventional wisdom says more levels equal more opportunities. The opposite is true on 1m–15m charts. Every extra level you draw is a potential excuse to enter a trade that does not meet your criteria. The discipline is in what you remove, not what you add.
Non-repainting signals paired with a Momentum Oscillator and Discord webhook alerts form a complete live workflow. The Momentum Oscillator handles timing; the S/R zone handles context; the webhook handles execution speed. Each piece has a job. When traders skip the oscillator confirmation and trade the zone alone, false entries spike.
The other thing worth saying: a level that has held four times in a session is not a fortress. Each touch consumes resting bids. By the fifth approach, the liquidity that defended it may be gone. The chart looks clean; the order book does not. That gap is where scalpers lose money on setups that look textbook.
Keep it tight: a few zones, one confirmation, one oscillator, one alert channel. That is the workflow.
Scalping-algo gives you every feature on that checklist
Most traders piece together three or four separate indicators to cover non-repaint signals, momentum confirmation, volatility gating, and webhook alerts. Scalping-algo bundles all of it into a single Pine Script v6 suite, purpose-built for 1m–15m execution.

The suite includes non-repainting buy/sell signals, the Momentum Oscillator for divergence confirmation, ATR-based volatility gating, multi-timeframe confluence, and native Discord webhook alerts with documented payload formatting. The backtesting dashboard lets you lock historical signals and compare them to live forward-test results before you risk real capital. The Discord community adds live mentorship and session-by-session feedback.
Every preset is tuned for 1m, 5m, and 15m charts across crypto, forex, indices, and futures. The scripts are open-source, so you can verify non-repaint enforcement yourself rather than take anyone's word for it.
Start with a demo account, enable the webhook alerts to a test Discord channel, and run a 1–2 hour forward session. Check the full indicator suite at Scalping-algo and see how the feature set maps to your buying checklist.
Useful sources
| Source | Why it's useful |
|---|---|
| TradingView S/R Levels: 5 Proven Tips — Kalena | DOM vs. chart-level validation; explains why repeated touches weaken levels and how to use order flow to confirm. |
| Best Non Repaint MT4 Indicator for Scalping — BinaryDiaries | Practical breakdown of non-repaint enforcement and why it is the baseline requirement for 1m/5m usability. |
| Non Repaint Buy Sell Signal Indicator MT4 — BinaryDiaries | Explains how pairing a directional signal with a momentum filter reduces false entries on low timeframes. |
| Support and Resistance on TradingView — TradingView.top | Covers VWAP as dynamic S/R and why auto-detection tools overfit on 5m charts without multi-timeframe anchoring. |
| Algo Master — 3-Indicator Suite — Scalping-algo | Maps the full feature set (non-repaint, volatility gating, divergence, backtesting) to the buyer checklist covered in this article. |