

Trend analysis step by step is the process of systematically examining time-series price and market data to identify meaningful directional movements that drive trading decisions. The industry term for this process is time-series trend analysis, and it combines statistical validation with structured decision-making to separate real signals from random noise. Traders who follow a repeatable framework, using tools like linear regression slope, R-squared validation, and segmentation techniques, consistently make better entries and exits than those who rely on gut feel. This guide walks you through every stage, from data preparation to converting findings into live trading actions.
What is the foundational framework for effective trend analysis?
A trend is a sustained directional movement in price or a market metric over a defined period. Three types exist: upward (higher highs and higher lows), downward (lower highs and lower lows), and flat (sideways consolidation with no clear bias). Identifying which type you are dealing with is the first decision in any analysis.
Two statistical measures do most of the heavy lifting. The slope of a linear regression line (expressed as Y = a + bX) tells you the rate of change. R-squared validates whether that slope is reliable. An R-squared above 0.70 signals a strong, dependable trend. Values between 0.40 and 0.70 indicate moderate trends with meaningful noise. Anything below 0.40 means the data is mostly noise, and forcing a linear model onto it produces false conclusions.

Data quality is non-negotiable before any of this math applies. Missing dates and inconsistent metric definitions create "phantom trends" that mislead traders into acting on patterns that do not exist. Normalization corrects these issues and makes comparisons across different time periods and asset classes valid.
Time frame selection also matters more than most traders realize. Industry guidance recommends 30–90 days for daily data, 12–26 weeks for weekly data, and 12–24 months for monthly metrics. These windows are long enough to capture complete market cycles without confusing seasonal patterns with structural shifts.
- Upward trend: Higher highs and higher lows; bias is long
- Downward trend: Lower highs and lower lows; bias is short
- Flat trend: Price oscillates in a range; mean-reversion setups apply
- R-squared above 0.70: Strong trend, reliable for position sizing
- R-squared below 0.40: Noise dominant, look for cyclical or structural patterns instead
Pro Tip: Before you run any regression, plot the raw data first. A visual scan catches obvious outliers and data gaps that statistics alone can miss.
How to prepare your data and define objectives for trend analysis?
The most common trend analysis mistake is starting with a vague question. Asking "What's trending?" produces vanity metrics, not trading decisions. Every analysis must begin with a specific, outcome-tied question. For example: "Has BTC/USD momentum on the 4-hour chart shifted from bullish to bearish over the past 60 days?" That question defines the metric, the asset, the time frame, and the decision it supports.
Follow these preparation steps in order:
- Frame a specific question. Tie it directly to a trading decision, such as scaling in, reducing exposure, or setting a stop level.
- Select primary and supporting metrics. Choose price action as the primary metric, then add volume, volatility measures, or momentum indicators as supporting data.
- Choose the right time window. Match the window to your trading style. Scalpers need 30–90 days of daily data at minimum. Swing traders benefit from 12–26 weeks of weekly data.
- Gather and clean your data. Check for missing dates, duplicate entries, and any system or feed changes that could introduce artificial breaks in the series.
- Normalize for fair comparison. If you are comparing two assets or two time periods, normalize returns or price levels so the comparison is apples to apples.
A well-scoped 5-day analysis cycle covering data gathering, cleaning, plotting, and translating patterns into recommendations is efficient for narrowly defined objectives. That speed only works when the question is tight and the data is already clean.
Pro Tip: Write your analysis question at the top of your chart or spreadsheet before touching the data. If you cannot state the question in one sentence, you are not ready to analyze.
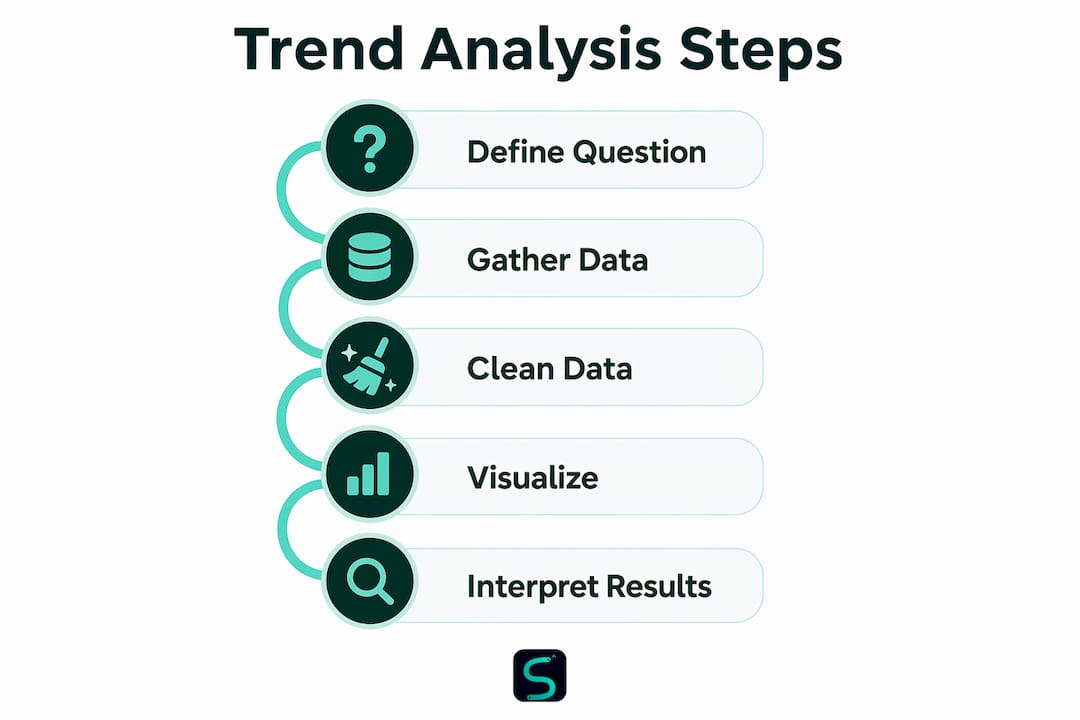
Step-by-step execution: visualizing, quantifying, and validating trends
Visualization comes first. Plot your data as a line chart and overlay a rolling average (20-period or 50-period are standard starting points). The rolling average smooths short-term noise and makes the underlying direction visible. Add a linear regression line to quantify the slope.
Once the chart is ready, read the slope and R-squared together. A steep positive slope with an R-squared above 0.70 confirms a strong uptrend worth acting on. A shallow slope with an R-squared below 0.40 tells you the market is chopping, not trending. R-squared acts as a key "BS detector" for trend claims. Never trade a trend signal that fails this validation.
Next, test for seasonality and one-time shocks. Year-over-Year (YoY) analysis reveals seasonal patterns and short-term shifts. CAGR smooths volatility to show long-term direction without distraction from short-term blips. Use both metrics together for a complete picture.
Segmentation is where most traders find the real insight. Separating true signals from noise requires breaking data down by controllable variables: asset class, market session, timeframe, or sector. A trend that holds across multiple segments is far more reliable than one that appears only in the aggregate.
| Validation check | What to look for | Action if it fails |
|---|---|---|
| R-squared above 0.70 | Strong linear trend present | Look for cyclical or range patterns |
| Slope direction | Positive or negative rate of change | Reassess time frame selection |
| YoY comparison | Seasonal vs. structural shift | Extend the time window |
| Segmentation test | Trend holds across sub-groups | Treat as noise, not signal |
| Outlier check | No single event drives the trend | Remove outlier and retest |
Pro Tip: Use momentum indicators alongside your regression line. Momentum divergence from price trend is an early warning that the trend is losing strength before the slope turns negative.
How to convert trend analysis insights into trading decisions?
Insight without action is just data. Every trend finding should map to one of four responses: monitor, investigate further, adjust your position, or escalate to a major strategic change. The response level depends on trend strength, duration, and the R-squared score.
Use this decision sequence:
- Classify the trend signal. Strong trend (R-squared above 0.70) with clear slope direction. This warrants a position adjustment or entry.
- Set a threshold for action. Define in advance what price level, slope angle, or momentum reading triggers a trade. Discretionary decisions made in the moment are the enemy of consistent execution.
- Size the position to the signal strength. A high R-squared, steep slope trend supports larger position sizing. A moderate trend (R-squared 0.40–0.70) warrants reduced size and tighter stops.
- Set alerts, not reminders. Configure price or indicator alerts so the market notifies you when the threshold is hit. Watching charts manually introduces emotional bias.
- Track the outcome. Trend analysis must be a repeatable cycle: define metrics, identify trends, act, and track results. Skipping the tracking step means you never learn whether your read was correct.
The tracking step is where most traders lose discipline. Recording what you expected versus what happened is the fastest way to refine your analysis process. Traders who treat trend analysis as an iterative rhythm improve their accuracy over time. Those who treat it as a one-time task repeat the same errors.
Common pitfalls in trend analysis and how to avoid them
Most trend analysis errors fall into a small number of repeatable categories. Knowing them in advance saves you from costly trades built on faulty reads.
- Vague questions produce useless answers. Analysis tied to vague questions chases vanity metrics instead of decisions. Always start with a specific, outcome-tied question.
- Poor data cleaning creates phantom trends. Missing dates, feed errors, and definition changes produce trends that do not exist in the market. Clean before you analyze, every time.
- Low R-squared means no trend to trade. An R-squared below 0.40 signals noise, not direction. Forcing a trade on that data is speculation, not analysis.
- Too few data points distort the slope. A regression line built on fewer than 20 data points is statistically unreliable. Extend your time window before drawing conclusions.
- Ignoring macro context. A trend in one asset or sector can be driven entirely by a macro event. Always check whether the trend holds after removing the event's impact.
- Skipping segmentation. A trend that disappears when you break data by session, asset class, or market condition was never a real trend. Segmentation separates enduring signals from temporary noise.
For traders using TradingView trend tools, the same rules apply. A confirmation indicator with a weak statistical base produces false signals. Validate the underlying trend before trusting any indicator output.
Pro Tip: Run your analysis on two different time frames simultaneously. If the trend does not appear on both, treat it as a lower-conviction signal and reduce your position size accordingly.
Key Takeaways
Effective trend analysis requires statistical validation, clean data, and a repeatable decision cycle that converts findings into specific trading actions.
| Point | Details |
|---|---|
| Validate with R-squared | Only trade trends with R-squared above 0.70; below 0.40 means noise, not direction. |
| Clean data first | Missing dates and inconsistent definitions create phantom trends that mislead execution. |
| Match time frames to style | Use 30–90 days for daily data; 12–26 weeks for weekly; 12–24 months for monthly analysis. |
| Segment to confirm | A trend that holds across multiple sub-groups is far more reliable than an aggregate signal. |
| Track every outcome | Recording expected vs. actual results is the only way to improve analysis accuracy over time. |
Why most traders get trend analysis backwards
Most traders I have worked with approach trend analysis the wrong way. They start with a chart, spot a move, and then build a narrative around it. That is pattern-matching, not analysis. Real trend analysis starts with a question, not a chart.
The shift that changed my own trading was treating data cleaning as the most important step, not a chore. Every phantom trend I ever chased traced back to a dirty data set: a feed error, a missing session, a metric that changed definition mid-series. Once I built a pre-analysis checklist, my false-signal rate dropped significantly.
The second shift was using R-squared as a hard filter. If the score is below 0.40, I do not trade the trend. Period. That single rule eliminated a category of losing trades that looked compelling on a chart but had no statistical backing.
Trend analysis is not a one-time event. It is a rhythm. Define, identify, segment, act, track, and repeat. Traders who build that rhythm into their weekly process, rather than running analysis only when they feel uncertain, develop a compounding edge over time. Pair that discipline with a well-built trading strategy and the results compound further.
— Tran
How Scalping-algo fits into your trend analysis process
Performing trend analysis effectively requires tools that keep pace with fast-moving markets. Scalping-algo's premium TradingView indicators are built in Pine Script v6 and generate real-time, non-repainting buy and sell signals on timeframes from 1 minute to 15 minutes. Each signal integrates volatility gating and divergence detection, so you are not acting on trend reads that fail basic statistical filters.

The platform's confluence tools let you layer multiple trend signals and validate them against momentum and volume data in one view. That is the step-by-step validation process described in this guide, built directly into the indicator suite. Traders who want to apply these methods without building custom scripts from scratch can explore the Algo Master indicator suite to see how the framework runs in live market conditions.
FAQ
What is trend analysis step by step in trading?
Trend analysis step by step is the process of defining a specific question, cleaning your data, visualizing direction with line charts and rolling averages, validating with R-squared and slope, segmenting by relevant variables, and converting findings into a trading decision. The process repeats as a cycle, not a one-time task.
What R-squared value confirms a tradeable trend?
An R-squared above 0.70 confirms a strong, reliable linear trend worth trading. Values between 0.40 and 0.70 indicate moderate trends with significant noise, and values below 0.40 mean the data shows no meaningful linear direction.
How long should my data window be for trend analysis?
Match the window to your data frequency. Daily data requires 30–90 days, weekly data requires 12–26 weeks, and monthly data requires 12–24 months to capture complete market cycles and avoid misreading seasonality as a structural trend.
Why does data cleaning matter so much for trend analysis?
Missing dates, feed errors, and inconsistent metric definitions create phantom trends that do not exist in the actual market. Cleaning and normalizing data before analysis is the prerequisite for any finding you can act on with confidence.
What is the difference between YoY and CAGR in trend analysis?
YoY (Year-over-Year) analysis highlights seasonal patterns and short-term shifts in market data. CAGR (Compound Annual Growth Rate) smooths short-term volatility to show long-term directional potential. Using both together gives a complete picture of trend behavior across different time horizons.