

Market volatility is defined as the magnitude and frequency of price changes in a security or index over a given period. It is the primary statistical signal traders and investors use to gauge market stress, opportunity, and risk. The CBOE Volatility Index (VIX), often called the "fear gauge," and standard deviation are the two most widely used industry measures for quantifying it. Understanding market volatility explained in full means recognizing that price swings are not just a threat. They are also the engine that creates profit opportunities, especially for short-term and algorithmic traders.
What causes market volatility in financial markets?
Volatility does not appear randomly. Specific, identifiable events trigger price swings, and volatility spikes when economic releases, central bank policy shifts, geopolitical events, and investor uncertainty converge.
The most common drivers include:
- Economic data releases. Inflation reports, employment figures, and GDP readings move markets because they shift expectations about future growth and interest rates. A surprise inflation print can send equities down sharply within minutes of release.
- Central bank decisions. Federal Reserve rate decisions carry outsized weight. When the Fed signals a faster-than-expected tightening cycle, bond yields reprice immediately and equity volatility follows.
- Geopolitical events. Wars, trade disputes, and tariff announcements create uncertainty about supply chains and corporate earnings. Historical examples include the 2018 U.S.–China trade war and the 2022 Russia-Ukraine conflict, both of which produced sustained volatility spikes across global indexes.
- Investor sentiment shifts. Fear and greed cycles amplify price moves beyond what fundamentals justify. Panic selling can push prices well below fair value in a matter of hours.
- Liquidity gaps. Low-volume sessions, such as pre-market or holiday trading, magnify price moves because fewer buyers and sellers are present to absorb order flow.
Recognizing these triggers in real time is the first step toward building a trading plan that accounts for elevated price swings rather than being caught off guard by them.
How is market volatility measured? Essential tools and metrics

Traders use several distinct tools to measure price fluctuation. Each one answers a slightly different question about the market.
Historical volatility
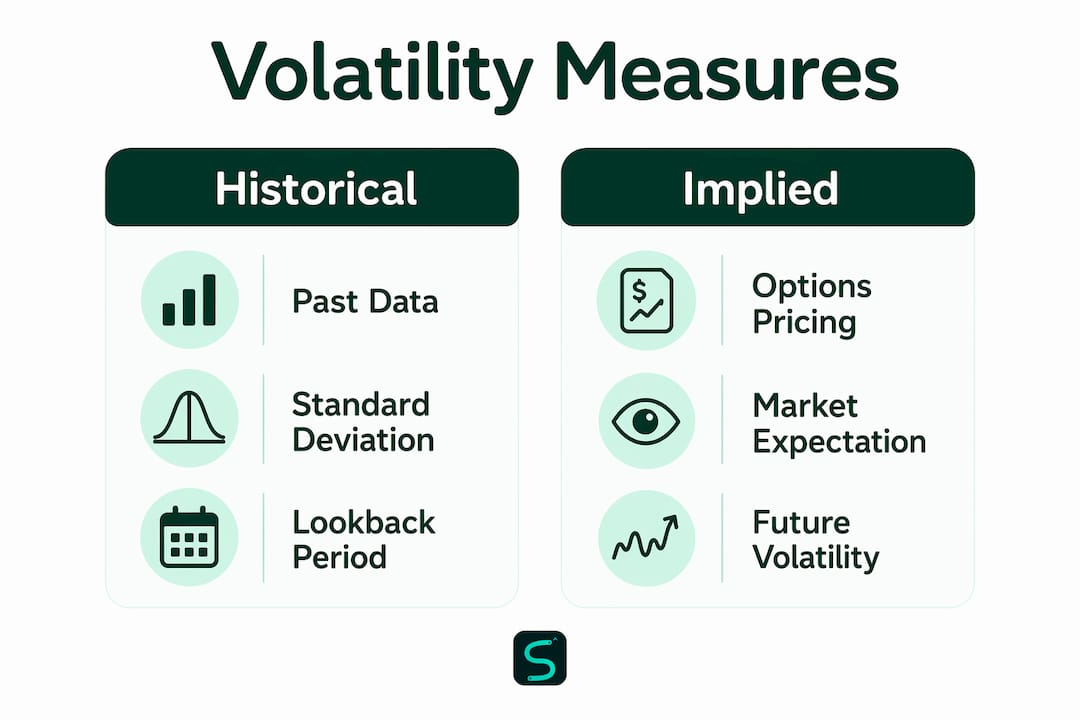
Historical volatility (HV) measures the standard deviation of past returns over a defined lookback period, typically 20 or 30 trading days. The S&P 500's annualized standard deviation sits at approximately 15%–18% under normal conditions. That benchmark gives traders a reference point. When realized volatility climbs above 25%, conditions are elevated. Above 35%, markets are in stress mode.
Implied volatility and the VIX
Implied volatility (IV) is derived from options pricing. It reflects what the market expects future volatility to be, not what it has been. The CBOE VIX Index measures implied volatility for the S&P 500 over the next 30 days. A VIX reading below 15 signals calm markets. A reading above 30 signals fear. A reading above 40 signals near-panic conditions, as seen during the 2020 COVID crash and the 2008 financial crisis.
Beta
Beta measures how much an individual stock moves relative to the broader market. A beta of 1.5 means the stock historically moves 50% more than the benchmark. High-beta stocks amplify both gains and losses during volatile periods, making them attractive to short-term traders and dangerous to underprepared ones.
ATR and Bollinger Bands
Average True Range (ATR) measures the average range between a session's high and low over a set period. It tells you how much a market is moving in absolute price terms, not percentage terms. Bollinger Bands plot two standard deviations above and below a moving average. When the bands widen, volatility is expanding. When they contract, a breakout is often building. Both tools are covered in depth in the top volatility indicators guide from Scalping-algo.
Pro Tip: Set your ATR period to 14 on the same timeframe you trade. If ATR doubles its 20-day average, widen your stop loss proportionally. This single adjustment prevents the majority of premature stop-outs during high-volatility sessions.
| Metric | What it measures | Best used for |
|---|---|---|
| Standard deviation (HV) | Past price dispersion | Benchmarking realized volatility |
| VIX | 30-day implied volatility on S&P 500 | Gauging overall market fear |
| Beta | Stock movement vs. benchmark | Comparing individual stock risk |
| ATR | Absolute daily price range | Sizing stops and position entries |
| Bollinger Bands | Price vs. rolling standard deviation | Spotting breakouts and contractions |
What is the difference between volatility and risk?
Volatility and risk are not the same thing. Volatility measures price fluctuations. Risk measures the probability of permanent capital loss. Treating them as identical is one of the most expensive mistakes traders and investors make.
Here is why the distinction matters:
- A stock that drops 20% in a week due to a market-wide panic has high volatility. If the underlying business is sound, that drop is temporary. No permanent capital loss has occurred yet.
- A stock that drops 20% because its core revenue model collapsed carries genuine risk. The loss may be permanent regardless of how calm the broader market is.
- Temporary large unrealized losses caused by volatility spikes do not necessarily indicate permanent capital loss, provided investors have sufficient liquidity and a long enough time horizon.
- Liquidity matters enormously. A trader forced to sell during a volatility spike converts a paper loss into a real one. An investor with cash reserves can hold through the drawdown.
- Investment horizon determines whether volatility is a problem or a non-event. A 10-year investor sitting through a 30% drawdown faces a very different reality than a trader with a two-week position.
Pro Tip: Before entering any position, ask yourself: "If this drops 30% tomorrow due to a market-wide event, can I hold it?" If the answer is no, your position size is too large for your actual risk tolerance.
Understanding this distinction is the foundation of risk management in trading. Volatility creates the conditions for loss, but it does not guarantee it.
How can traders and investors manage and leverage market volatility?
Volatility is not just a hazard to manage. It is the raw material that creates profit opportunities. The S&P 500 typically sees about 1% daily price movement under normal conditions, but during high-volatility periods, daily swings of 3%–5% become common. That expanded range is exactly what short-term traders need to generate returns.
Here are five practical approaches for different trader and investor profiles:
-
Use volatility gating for entries. Volatility gating means only taking trades when volatility is within a defined range. Entering during extreme spikes increases slippage and stop-out risk. Waiting for the first pullback after a spike often provides a better risk-to-reward setup. Volatility gating and ATR are core tools used by professional traders to adapt stop-loss placement dynamically.
-
Adjust stop losses with ATR. Fixed stop losses fail in volatile markets. A stop set at $1.00 below entry on a stock with a $3.00 ATR will get hit by normal noise. Multiply ATR by 1.5 to 2.0 and place your stop at that distance. This keeps you in trades that are moving normally while protecting against genuine reversals.
-
Buy dips with a plan, not emotion. Volatility tends to normalize after acute spikes, providing favorable risk-to-reward entry points for disciplined investors. The key word is disciplined. Define your entry price before the dip happens, not during it. Emotional buying during a panic rarely results in optimal entries.
-
Diversify across uncorrelated assets. A portfolio split across equities, bonds, commodities, and cash does not eliminate volatility, but it reduces the impact of any single market's swings on total portfolio value. Correlation between asset classes shifts during crises, so review your allocations regularly rather than assuming past correlations hold.
-
Apply algorithmic tools for consistent execution. Human psychology degrades under pressure. Algorithms do not panic. Short-term and algorithmic traders benefit from volatility because expanded price ranges create larger potential moves per trade. Scalping-algo's indicators include built-in volatility gating that filters signals during extreme conditions, keeping traders out of the most dangerous setups automatically.
For a deeper look at how volatility functions specifically in short-term trading, the role of volatility in scalping guide from Scalping-algo covers the mechanics in detail.
Senior investors managing retirement assets face a different challenge. Managing emotions and aligning risk tolerance with strategy becomes the priority when capital preservation matters more than growth.
Key Takeaways
Market volatility is a measurable, manageable market condition. The traders who profit from it are the ones who understand its causes, measure it with the right tools, and execute with a plan.
| Point | Details |
|---|---|
| Volatility is not risk | Volatility measures price swings; risk measures the probability of permanent capital loss. |
| VIX is the benchmark fear gauge | A VIX above 30 signals elevated fear; above 40 signals near-panic market conditions. |
| ATR drives stop placement | Multiply ATR by 1.5–2.0 to set stops that survive normal noise in volatile sessions. |
| Mean reversion is real | Sharp volatility spikes historically normalize over time, creating disciplined entry opportunities. |
| Algorithmic tools reduce emotional errors | Volatility gating in tools like Scalping-algo filters out the most dangerous trade setups automatically. |
What I've learned from trading through volatility cycles
Volatility looks simple on a chart. In real time, it is a different experience entirely. I have watched traders with solid systems blow up their accounts not because their edge failed, but because they abandoned their rules the moment a market moved faster than they expected.
The most consistent mistake I see is confusing activity with opportunity. When the VIX spikes above 35, every candle looks like a trade. Most of them are traps. Panic selling drives prices below fundamentals temporarily, and volatility tends to mean-revert. That fact is intellectually easy to accept and psychologically brutal to act on when your open position is down 4% in 20 minutes.
The traders who perform best during volatile periods are the ones who prepared their rules before the volatility arrived. They know their ATR-adjusted stop levels. They know their maximum daily loss. They know which setups they will take and which ones they will skip. Scalping-algo's volatility gating feature does part of that work automatically, filtering signals when conditions fall outside defined parameters. That is not a crutch. That is discipline built into the system.
My honest advice: treat every high-volatility session as a test of your process, not a chance to recover losses. The market will give you another opportunity. Your capital will not come back if you force trades during the worst conditions.
— Tran
Scalping-algo's tools for volatile market conditions
Volatile markets reward traders who have the right tools ready before the move happens.

Scalping-algo's premium TradingView indicators are built specifically for the conditions described in this article. The indicators run on Pine Script v6, generate real-time non-repainting signals on timeframes from 1 minute to 15 minutes, and include built-in volatility gating that filters entries when market conditions are too extreme for reliable execution. The Algo Master 3-indicator suite combines signal generation, confluence confirmation, and ATR-based stop management in one system. For traders who want to put these principles to work immediately, Scalping-algo's tools are built to handle the conditions that break underprepared traders.
FAQ
What is market volatility in simple terms?
Market volatility is the rate at which a security's price moves up or down over a given period. Higher volatility means larger, faster price swings in either direction.
What does a VIX reading above 30 mean?
A VIX above 30 signals that options markets expect significant S&P 500 price swings over the next 30 days. Readings above 40 indicate near-panic conditions in the broader market.
Is high volatility always bad for investors?
High volatility is not inherently bad. It creates risk for underprepared traders but also creates buying opportunities for disciplined investors, particularly when prices drop below fundamental value temporarily.
How do traders use ATR to manage volatility?
Traders multiply the Average True Range by 1.5 to 2.0 to set stop-loss distances that account for normal price noise. This prevents premature stop-outs during high-volatility sessions.
What is the difference between implied and historical volatility?
Historical volatility measures past price fluctuations using standard deviation. Implied volatility, reflected in the VIX, measures what the market expects future volatility to be based on current options pricing.