
Market volatility is defined as the rate and magnitude at which asset prices move up or down over a given period. Monitoring it is the single most reliable way to understand whether markets are calm or stressed before you place a trade. Traders who track volatility consistently use tools like the VIX, Parkinson estimators, and Garman-Klass models to read market conditions rather than guess at them. The difference between reacting to price moves and anticipating them comes down to one habit: knowing why monitor market volatility matters and building that awareness into every session.
What are the primary indicators used to monitor market volatility?
The VIX is the foremost equity market volatility gauge. It measures expected 30-day volatility derived from S&P 500 option prices, which is why traders call it the "fear index." A VIX reading above 30 signals heightened fear and uncertainty in the market. That threshold tells you conditions have shifted from routine fluctuation to genuine stress.
Range-based estimators like the Parkinson and Garman-Klass models take a different approach. Instead of relying on closing prices, they capture intra-period price ranges using high, low, open, and close data. This makes them better at detecting volatility shocks that reverse quickly, the kind of move that closes at a normal level but hit extreme intraday swings. Standard closing-price measures miss those entirely.

The table below shows how these two approaches compare in practice:
| Feature | VIX | Range-Based Estimators (Parkinson, Garman-Klass) |
|---|---|---|
| Data source | S&P 500 options pricing | OHLC price data |
| What it measures | Expected 30-day implied volatility | Realized intra-period price range |
| Best use case | Gauging market-wide fear and sentiment | Detecting intraday shocks and stress signals |
| Asset coverage | Equity markets (S&P 500) | Multi-asset (forex, crypto, futures, indices) |
| Sensitivity to spikes | Moderate, forward-looking | High, captures rapid reversals |
Knowing which tool fits your asset class matters. Scalping-algo's TradingView indicators incorporate volatility gating, which filters signals based on current volatility conditions. That means you get entries calibrated to the environment, not just the price pattern.
Pro Tip: Use the VIX as your macro context check and a range-based estimator as your intraday stress detector. Running both together gives you a fuller picture of market conditions than either tool alone.
Why monitor market volatility consistently to improve outcomes?
Consistent monitoring of price fluctuations reduces emotional decisions. Continuous market awareness shifts your mindset from reacting to sudden moves to anticipating them. That shift is not minor. It changes how you size positions, when you exit, and how calm you stay when prices spike.
The behavioral case for regular tracking is strong. Emotional mistakes peak after sharp drawdowns, when risk feels expanded and options feel limited. Traders who already know the volatility environment going into a session are less likely to panic sell or chase entries. Awareness acts as a buffer between the market's noise and your decision-making.
Here are the core behavioral benefits of tracking market fluctuations on a structured schedule:
- Reduced surprise losses. Knowing that volatility is elevated before a session means you are not caught off guard by wide spreads or fast moves.
- Cleaner entries and exits. Volatility context tells you whether a breakout is happening in a high-fear environment or a low-fear drift, which changes how you trade it.
- Better position sizing. High volatility periods call for smaller size. Monitoring gives you the data to make that call before the trade, not after.
- Stronger pattern recognition. Tracking trends in volatility over time builds the skill of distinguishing regime changes from one-day noise.
- Less monitoring fatigue. Structured check-ins at defined intervals beat staring at screens all day. Monitoring fatigue harms decision quality just as much as ignoring volatility entirely.
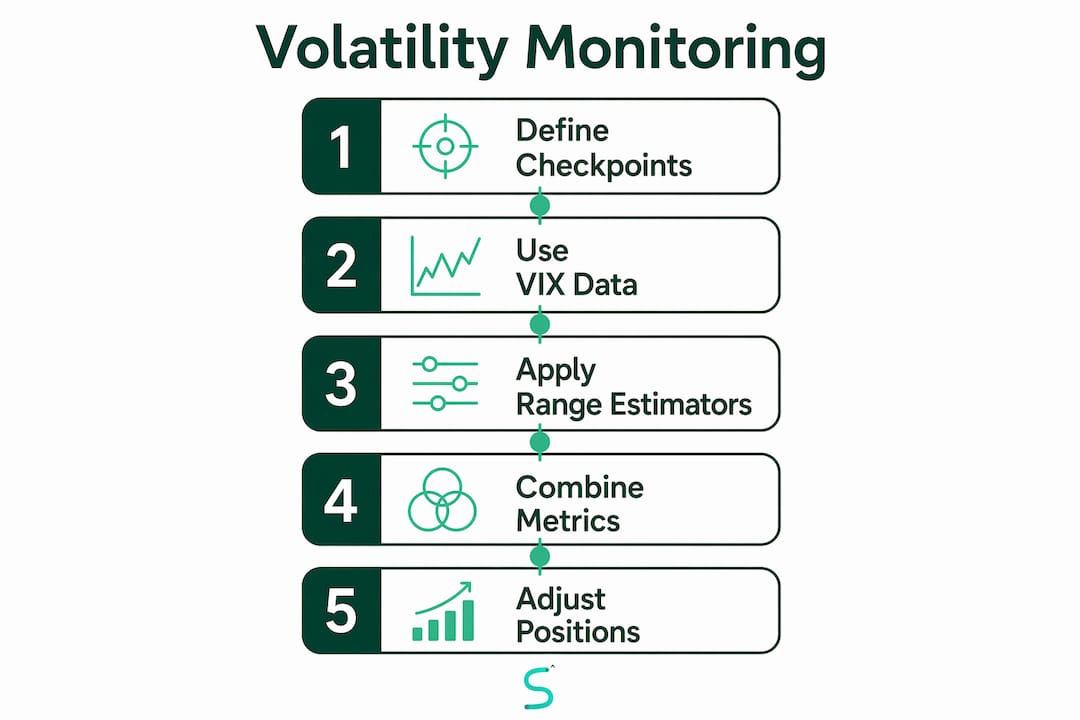
Pro Tip: Set two or three fixed volatility check points per session rather than watching every tick. Define what VIX level or range expansion would trigger a strategy adjustment, and only act when that threshold is hit.
Volatility indicators also work best when combined with volume, sentiment, and scheduled economic event awareness. Strong market awareness includes price direction, volume, and macro calendar context together. No single indicator tells the full story.
How do traders apply volatility insights to manage risk?
Volatility monitoring translates directly into risk management decisions. The most practical application is position sizing: when volatility spikes, reduce your position size to keep dollar risk per trade constant. A move that covers 20 points in a low-volatility session might cover 80 points in a high-volatility one. Same setup, four times the risk if you do not adjust.
Institutional traders go further. They monitor liquidity flows and sector sentiment to catch early signals of market shifts before price confirms them. ETF flows, options skew, and sector rotation patterns all move before the headline price does. Retail traders who adopt this layer of awareness gain an edge that pure price analysis does not provide.
Here is a practical framework for applying volatility data to your trading process:
- Check the VIX before the session opens. A reading above 30 means you are trading in a fear-driven environment. Tighten stops and reduce size.
- Use a range-based estimator on your specific asset. The VIX covers equities. For forex, crypto, or futures, apply Parkinson or Garman-Klass models to your actual instrument.
- Define your volatility triggers in advance. Set a specific level at which you will cut exposure or switch to a defensive strategy. Write it down before the market opens.
- Separate news-driven spikes from structural shifts. A spike on a single headline often reverses. A sustained rise in volatility over several sessions signals a regime change worth responding to.
- Review your risk management process after each high-volatility session. Track what worked and what did not. Volatility patterns repeat across cycles.
The table below maps volatility environments to practical strategy adjustments:
| Volatility Environment | VIX Level | Recommended Adjustment |
|---|---|---|
| Low volatility | Below 15 | Normal position size, wider targets |
| Moderate volatility | 15–30 | Standard size, tighter stops |
| High volatility | Above 30 | Reduced size, defined triggers only |
| Extreme volatility | Above 40 | Minimal exposure, defensive posture |
Setting predefined triggers and response plans removes the emotional variable from high-pressure moments. You are not deciding what to do when the market is moving. You already decided.
Common misconceptions about tracking price volatility
Volatility is not risk itself. Volatility identifies extreme trend conditions and signals a change in market environment. Treating every spike as a crisis leads to over-trading and unnecessary exits from solid positions.
The most common mistakes traders make when interpreting volatility signals:
- Equating volatility with loss. High volatility means larger price swings in both directions. Professional traders treat extreme volatility as opportunity with clear rules, not just danger to avoid.
- Reacting to every headline. News-driven spikes often reverse within hours. Not every volatility move warrants a portfolio change. Assess whether the news actually alters your long-term thesis.
- Ignoring the source of volatility. A VIX spike driven by geopolitical fear behaves differently from one driven by a Federal Reserve announcement. Context determines the correct response.
- Checking too frequently. Investors who check portfolios daily suffer amplified loss aversion and are more likely to make impulsive decisions during downturns. Structured intervals beat constant surveillance.
- Using volatility as the only filter. Volatility data works best alongside technical analysis, volume, and sector sentiment monitoring for a complete picture.
The goal of monitoring volatility is not to react faster. It is to react smarter, and sometimes not at all.
Key Takeaways
Monitoring market volatility gives traders the context to size positions correctly, time entries with confidence, and avoid emotional decisions driven by noise rather than data.
| Point | Details |
|---|---|
| VIX as the baseline gauge | A VIX reading above 30 signals fear-driven conditions requiring tighter stops and smaller positions. |
| Range-based estimators add depth | Parkinson and Garman-Klass models detect intraday shocks that closing-price measures miss entirely. |
| Consistency reduces emotion | Structured volatility check-ins shift behavior from reactive panic to pre-planned, calm execution. |
| Predefined triggers are non-negotiable | Setting volatility thresholds before the session removes emotional decision-making in real time. |
| Volatility is not the same as risk | High volatility signals a changed environment, not automatic loss. Context determines the right response. |
Volatility monitoring changed how I trade, not just what I trade
The traders I see struggle most are not the ones who lack technical skill. They are the ones who treat every spike as an emergency. I spent years watching good setups get abandoned because the VIX moved five points, or a news headline hit the wire. The setup was still valid. The environment had not actually changed. The reaction was pure emotion dressed up as risk management.
What shifted my own approach was building a trading psychology framework around volatility triggers rather than price triggers. I stopped asking "what is the market doing right now?" and started asking "what volatility regime am I operating in today?" That single reframe cut my impulsive exits by more than half.
The other thing I will say plainly: anticipation beats reaction every time in fast markets. When you know the VIX is elevated before the open, you are not surprised when your stop gets hit on a wide spread. You already planned for it. That calm is not natural. It is built through consistent monitoring and pre-session preparation.
My advice is simple. Pick two volatility tools. Set your thresholds. Check them at fixed points in your session. Do not check them every five minutes. The market will still be there. Your edge comes from preparation, not surveillance.
— Tran
Scalping-algo's volatility tools for sharper trade execution
Volatility data is only useful when your indicators are built to act on it. Scalping-algo's premium TradingView indicators include built-in volatility gating that filters buy and sell signals based on current market conditions. That means you get cleaner entries on lower timeframes (1m–15m) without chasing signals generated in chaotic, low-liquidity environments.
The Algo Master suite takes this further with a 3-indicator trading system designed to surface volatility and momentum signals together. All scripts are open-source and built in Pine Script v6, with native webhook alerts to Discord for fast execution. Whether you trade crypto, forex, indices, or futures, the tools are calibrated to help you read volatility shifts and act on them with discipline.
FAQ
What is market volatility and why does it matter?
Market volatility measures how fast and how much asset prices change over time. Traders monitor it to assess market conditions, size positions correctly, and avoid being caught off guard by sudden price swings.
What does the VIX measure?
The VIX measures expected 30-day volatility based on S&P 500 option prices. A reading above 30 signals elevated fear and uncertainty in equity markets.
How is the VIX different from range-based volatility estimators?
The VIX uses options pricing to forecast implied volatility, while range-based estimators like Parkinson and Garman-Klass use actual high, low, open, and close price data to detect realized intraday stress and rapid reversals.
How often should traders check volatility indicators?
Traders should check volatility at fixed intervals, such as pre-session and mid-session, rather than continuously. Checking too frequently increases loss aversion and leads to impulsive decisions during normal market fluctuations.
Does high volatility always mean you should exit a trade?
High volatility signals a changed market environment, not automatic loss. Professional traders use predefined volatility thresholds to decide when to reduce size or adjust stops, rather than exiting every time conditions shift.