
Parameters in trading indicators are explicit numeric inputs — such as lookback length, thresholds, and multipliers — that directly control how an indicator calculates and generates signals. The role of parameters in indicators determines everything from signal frequency to sensitivity to market noise. Get them wrong, and a perfectly sound indicator strategy produces garbage entries. Get them right, and the same indicator becomes a precision tool. This guide covers how parameters affect sensitivity, how to test for robustness, and how to apply these principles to ATR, RSI, and MACD in live trading conditions.
How do parameters affect indicator sensitivity and trading signals?
Parameters are the control knobs of any indicator. Change the period length on a moving average from 20 to 50, and you shift from a short-term trend follower to a medium-term trend filter. The same logic applies across every indicator class. Numeric inputs like lookback length directly control what price data the indicator processes and how it weights recent versus older data.
The most direct effect of parameter choice is sensitivity. A shorter lookback period produces more signals, reacts faster to price changes, and generates more false positives. A longer period smooths out noise but lags behind real moves. This trade-off is not a flaw. It is a design choice that must match your trading timeframe and market context.
Bollinger Bands illustrate this clearly. The default 20-period, 2 standard deviation setting produces bands that contain roughly 95% of price action in a normal distribution. Reduce the period to 10 and the bands tighten and widen more aggressively, generating more breakout signals. Increase the standard deviation multiplier to 2.5 and fewer signals fire, but each one carries more statistical weight. Neither setting is universally better. The right choice depends on the asset's volatility profile and your holding period.
Key parameters affecting indicator behavior include:
- Period length: Controls the lookback window and directly determines lag versus responsiveness
- Threshold values: Define overbought or oversold zones in oscillators like RSI; moving these from the default 70/30 to 80/20 filters out weaker signals
- Multipliers: In ATR-based indicators, the multiplier scales the volatility band width and affects stop placement
- Style and color flags: In platforms like AmiBroker, parameters like style and color also control visual output, which matters for chart-based decision making
Pro Tip: Never accept default parameters as final. Treat them as a starting hypothesis. The default RSI length of 14 was designed for daily charts in the 1970s commodity markets. On a 5-minute crypto chart, it behaves very differently.
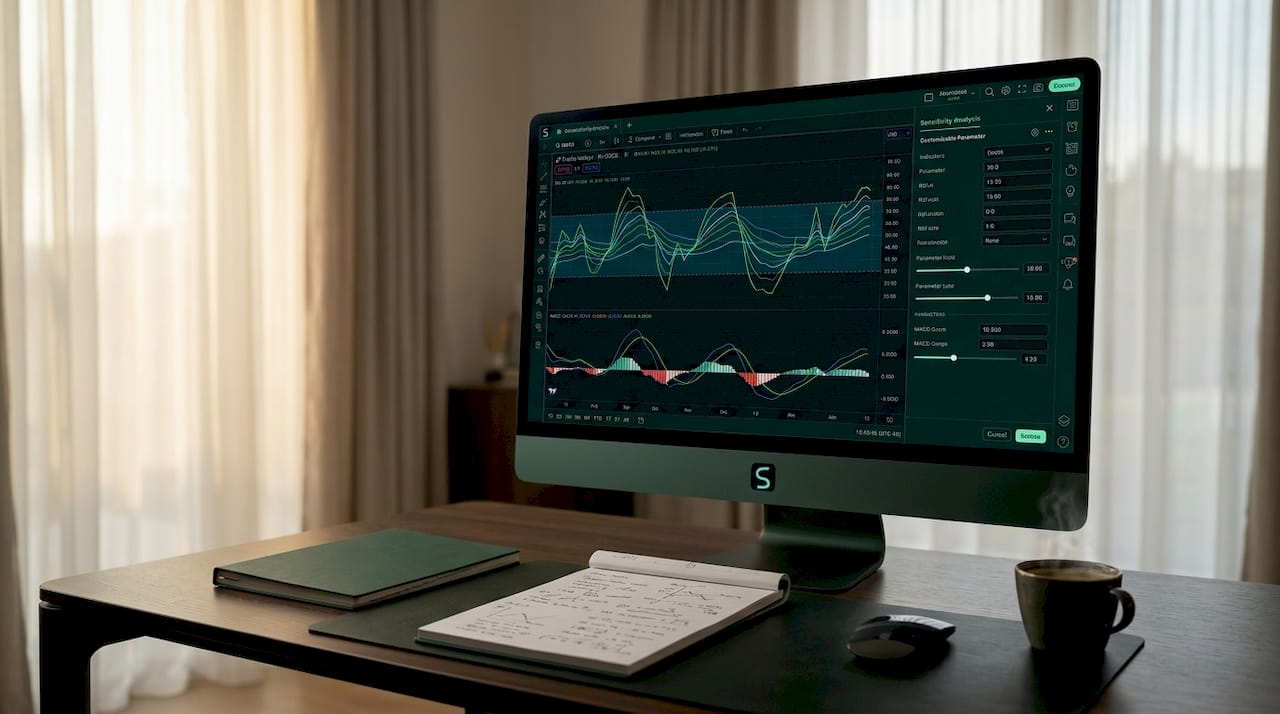
What is parameter sensitivity analysis and why does it matter?
Parameter sensitivity analysis is the practice of systematically testing how indicator or strategy performance changes as you vary inputs around an optimal value. It is the single most reliable method for distinguishing genuine market edge from curve-fitted noise. Sensitivity analysis reveals whether your indicator logic captures real market structure or simply memorized historical data.
The core concept is the performance plateau versus the performance peak. A sharp peak means your strategy only works at one precise parameter value. Move one step in any direction and performance collapses. A wide plateau means the strategy performs consistently across a range of values. That is the region you want to operate in.
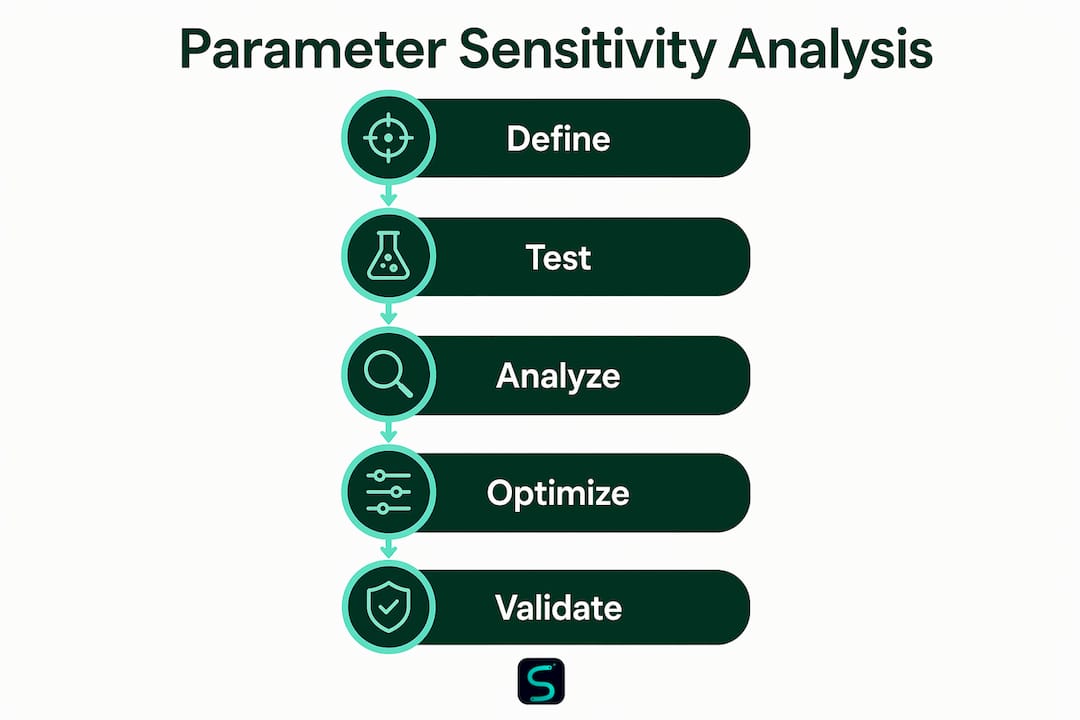
Here is a structured approach to running sensitivity tests:
- Identify your baseline parameter: Start with the default or your current optimized value, for example RSI length = 14.
- Define the test range: Test at ±10%, ±20%, and ±30% from the baseline. For RSI 14, that means testing lengths of 10, 11, 12, 13, 14, 15, 16, 17, and 18.
- Record performance metrics: Track win rate, profit factor, and maximum drawdown at each value.
- Map the results visually: Use a heatmap or line chart to identify plateau regions versus isolated spikes.
- Select from the plateau: Choose a parameter value that sits inside a stable performance region, not at the single best-performing point.
The risk of ignoring this process is severe. A 20-period Bollinger Band strategy optimized to a specific setting showed +45% return, but performance dropped sharply to negative territory with even minor parameter changes. That is a fragile strategy. It will fail in live trading the moment market conditions shift slightly.
| Approach | Parameter region | Risk level | Reliability |
|---|---|---|---|
| Single peak optimization | Narrow spike | High overfitting risk | Low out-of-sample |
| Plateau selection | Wide stable zone | Low overfitting risk | High out-of-sample |
| Default parameters | Vendor convention | Medium | Context-dependent |
Pro Tip: Use a 3D heatmap when testing two parameters simultaneously, such as RSI length and RSI threshold. The visual geometry of peaks and plateaus tells you more in 10 seconds than a spreadsheet of numbers tells you in an hour.
Overfitting in quantitative strategies occurs when a strategy's performance is too sensitive to exact parameter values, causing it to fail out-of-sample. Robustness means stable performance across a neighborhood of values, not just a single best point.
How do parameters influence ATR, RSI, and MACD specifically?
Understanding how parameters influence indicators at the individual level gives you precise control over your trading system. The three most widely used indicators each respond to parameter changes in distinct ways.
ATR: volatility regime and position sizing
The Average True Range uses a single primary parameter: the lookback length, defaulting to 14 periods. ATR's 14-day default influences how the indicator classifies volatility regimes and scales position sizing decisions. Shorten the ATR period to 7 and it becomes highly reactive, picking up intraday volatility spikes quickly. Extend it to 21 or 28 and it smooths over short bursts, reflecting a more stable volatility baseline.
Changing ATR lookback length shifts volatility regime boundaries, which can cause discontinuous strategy behavior. A grid trading system using ATR for spacing will place tighter grids in a low-ATR reading and wider grids in a high-ATR reading. Adjust the period and you change what counts as "low" or "high," which cascades into every downstream decision. For scalpers, this matters on the ATR parameter and volatility relationship directly affects stop placement and trade frequency.
RSI: momentum detection and signal filtering
RSI uses a single period parameter, with 14 as the universal default across platforms including OpenBB and TradingView. Default RSI length of 14 is a starting template, not a guaranteed optimal setting for every market. On lower timeframes like 1-minute or 5-minute charts, RSI 14 produces sluggish signals. Many scalpers shift to RSI 7 or RSI 9 for faster momentum reads. The trade-off is more whipsaw signals and more frequent overbought or oversold readings that do not resolve into meaningful moves.
Adjusting the overbought and oversold thresholds adds a second layer of parameter control. Moving from the default 70/30 to 80/20 filters out weaker signals and reduces trade frequency, but the signals that do fire carry higher conviction. This is a direct example of how parameters affecting indicators change not just timing but signal quality.
MACD: signal timing and crossover frequency
MACD has three parameters: fast EMA period (default 12), slow EMA period (default 26), and signal line period (default 9). MACD defaults of 12/26/9 define the baseline signal behavior but require customization for different market contexts. Tightening the fast and slow periods, for example to 8/17/9, produces earlier crossovers and more signals. Widening them to 19/39/9 produces fewer, slower signals that suit swing trading rather than scalping.
Key parameter effects across these three indicators:
- ATR period: Shorter = more reactive volatility reads; longer = smoother baseline for position sizing
- RSI period: Shorter = faster momentum signals with more noise; longer = cleaner signals with more lag
- MACD fast/slow spread: Narrower spread = more crossovers; wider spread = fewer but higher-conviction signals
- MACD signal period: Shorter = earlier triggers; longer = more confirmation before entry
What are best practices for selecting and validating indicator parameters?
Parameter selection is not a one-time task. It is an ongoing process that requires the same discipline as any other part of a trading system. The most common mistake traders make is optimizing parameters on a full historical dataset and then trading live without any out-of-sample validation.
The right workflow looks like this:
- Treat every parameter as a hypothesis: Default values are conventions, not truths. Default parameters are conventions that should be treated as starting points requiring tuning per market context.
- Use platform tools for iterative adjustment: AmiBroker provides interactive parameter adjustment tools that let you evaluate signal impacts in real time. TradingView's Pine Script v6 supports input() functions that make parameter testing fast and visual.
- Run out-of-sample tests: Split your data. Optimize on the first 70%, then validate on the remaining 30% without touching the parameters. If performance degrades sharply, the parameters are overfit.
- Apply walk-forward testing: Roll your optimization window forward in time, re-optimizing periodically. This simulates real trading conditions and reveals whether your parameter choices remain valid as market regimes shift.
- Choose plateau values, not peak values: Robust traders prioritize parameters that perform well over a neighborhood of values rather than depending on a narrow peak. A parameter that produces a 2.1 profit factor across a range of 10 to 18 is more trustworthy than one that hits 2.8 only at exactly 14.
- Monitor for regime shifts: Markets change. A parameter set that worked in a trending 2024 crypto market may underperform in a choppy 2026 range-bound environment. Build a review schedule into your trading process.
Pro Tip: Watch for hidden parameter semantics. Some indicators in platforms like OpenBB include lookahead flags on indicators like Ichimoku and Fisher that affect signal timing. Enabling lookahead in a backtest introduces data leakage and produces unrealistically strong results that will not replicate in live trading.
For traders working on precision scalping with indicators, parameter validation is especially critical because small timing differences on a 1-minute chart translate directly into entry quality and slippage.
Key takeaways
Parameters are the mechanism through which indicator logic connects to market reality, and selecting them from stable performance plateaus rather than optimized peaks is the defining difference between a robust strategy and a fragile one.
| Point | Details |
|---|---|
| Parameters define signal behavior | Lookback length, thresholds, and multipliers control sensitivity, lag, and signal frequency. |
| Sensitivity analysis prevents overfitting | Testing ±10% to ±30% variations identifies robust plateau regions over fragile single-point peaks. |
| Each indicator responds differently | ATR, RSI, and MACD each have distinct parameter mechanics that require context-specific tuning. |
| Defaults are starting points only | Platform defaults from OpenBB and TradingView are conventions, not optimal values for every market. |
| Ongoing validation is non-negotiable | Walk-forward testing and regime monitoring keep parameters aligned with current market conditions. |
Why most traders get parameters completely wrong
I have watched traders spend hours optimizing an RSI period down to the decimal equivalent of a whole number, chasing the single best backtest result, then wonder why the strategy falls apart in week two of live trading. The problem is not the indicator. The problem is treating optimization as a destination rather than a process.
The insight that changed how I approach this: parameter sensitivity is not a technical check you run once. It is a lens you apply continuously. When a strategy starts underperforming, the first question should not be "is the market broken?" It should be "have market conditions shifted enough that my parameter assumptions no longer hold?"
I have seen traders using institutional-grade indicator setups with beautifully tuned parameters fail simply because they never updated those parameters after a volatility regime change. The ATR period that worked perfectly in a high-volatility 2024 crypto cycle produced dangerously wide stops in the compressed volatility of early 2026. Same indicator, same logic, different outcome because the parameter no longer matched the environment.
The traders who consistently perform well treat their parameter sets the way a pilot treats a pre-flight checklist. Not as bureaucratic overhead, but as a live confirmation that the system is calibrated for current conditions. That mindset shift, from "set and forget" to "set, test, monitor, and adjust," is the actual edge that separates systematic traders from gamblers with charts.
— Tran
Get better signals with Scalping-Algo's configurable indicators
Scalping-Algo builds its premium TradingView indicators with parameter configurability at the core. Every indicator in the suite, built in Pine Script v6, exposes adjustable inputs for period lengths, multipliers, and thresholds directly in the TradingView settings panel. You can test parameter variations in real time without touching a line of code. The indicators are designed for 1m to 15m scalping across crypto, forex, and futures, with volatility gating that adapts to regime shifts automatically. If you want to stop guessing at parameter values and start trading with a system built for robustness, explore the premium scalping indicator suite at Scalping-Algo. For a deeper look at how a three-indicator system uses parameters for strategy advantages, check out the Algo Master suite.
FAQ
What are parameters in trading indicators?
Parameters are explicit numeric inputs such as period length, threshold values, and multipliers that control how an indicator calculates and outputs signals. Changing these values directly changes the indicator's sensitivity, lag, and signal frequency.
Why does parameter selection matter for trading performance?
The wrong parameter values cause indicators to generate false signals or miss valid entries. A strategy optimized to a single parameter value can show strong backtests but collapse in live trading if that value sits on a performance peak rather than a stable plateau.
What is parameter sensitivity analysis?
Parameter sensitivity analysis tests how strategy performance changes as inputs vary by ±10%, ±20%, and ±30% from an optimal value. Wide, stable performance regions indicate robustness; narrow spikes indicate overfitting to historical data.
What are the default parameters for RSI and MACD?
RSI defaults to a period of 14, while MACD defaults to fast period 12, slow period 26, and signal period 9. These are starting conventions documented in platforms like OpenBB and TradingView, not guaranteed optimal values for every asset or timeframe.
How often should traders update their indicator parameters?
Parameters should be reviewed whenever market conditions shift significantly, such as after a volatility regime change or a structural market event. Walk-forward testing on a rolling basis is the most reliable method for keeping parameters aligned with current conditions.