

An RSI divergence strategy works by identifying when price makes a new high or low while the RSI indicator moves in the opposite direction, signaling weakening momentum that often precedes a reversal or continuation move. Here is the three-step execution you need to memorize: spot the divergence by comparing two clear price swings to the corresponding RSI swings, confirm with a structural break or reversal candle before touching the entry button, and trade with your stop beyond the swing extreme and a minimum 2:1 reward-to-risk target. Always size positions at 1–2% of account risk per trade. That is the whole framework. Everything below builds the precision around it.
Key Takeaways
| Point | Details |
|---|---|
| Hidden divergence is higher probability | Hit rates run approximately 65–75% with proper structure vs. 55–65% for regular divergence. |
| Confirmation is non-negotiable | Always wait for a reversal candle close or structural break before entering any divergence trade. |
| Stop beyond the swing extreme | Place stops past the divergence low or high plus a 0.5 ATR buffer to avoid noise-driven exits. |
| Backtest before going live | Log at least 200 signals, track win rate, average R:R, and expectancy, then forward-test on demo for three weeks. |
| Scalping-algo automates the ruleset | Non-repainting divergence detection, volatility gating, and multi-timeframe confluence are built into the indicator suite. |
Table of Contents
- What is RSI divergence and what are the four types?
- How does RSI actually produce divergence signals?
- How to spot valid RSI divergence on a chart
- Which confirmation signals actually raise your win rate?
- Concrete strategy rules with two trade examples
- How to backtest an RSI divergence strategy properly
- What RSI settings and timeframes work best for divergence?
- Why RSI divergence fails and how to avoid the common traps
- Your quick-reference checklist for every divergence trade
- The divergence signal most traders undervalue
- Scalping-algo's divergence tools map directly to this strategy
- Sources
What is RSI divergence and what are the four types?
Divergence occurs when price and a momentum indicator move in opposite directions, highlighting weakening momentum that can precede trend shifts. It is not a guaranteed reversal signal. Think of it as a yellow flag, not a green light.
The RSI (Relative Strength Index) is the most widely used oscillator for spotting divergence because its 0–100 scale makes peaks and troughs easy to compare visually. There are four canonical types, and knowing which one you are looking at determines whether you are trading a reversal or a continuation.
- Regular bullish divergence: Price prints a lower low; RSI prints a higher low. Signals potential reversal to the upside. Classic setup after a downtrend.
- Regular bearish divergence: Price prints a higher high; RSI prints a lower high. Signals potential reversal to the downside. Appears near the top of a rally.
- Hidden bullish divergence: Price prints a higher low (trend is up); RSI prints a lower low. Signals trend continuation upward. This is the pullback-entry setup in an uptrend.
- Hidden bearish divergence: Price prints a lower high (trend is down); RSI prints a higher high. Signals trend continuation downward. The short-entry setup during a downtrend pullback.
The key distinction between regular and hidden divergence is the trading implication. Regular divergence says the current trend is losing steam and may reverse. Hidden divergence says the pullback is shallow and the trend is intact. For traders focused on trend-following, hidden divergence is the higher-probability setup.
A quick verbal example: on a 1-hour EUR/USD chart in an uptrend, price pulls back from 1.0950 to 1.0900 (a higher low vs. the prior swing at 1.0870). If RSI simultaneously drops from 52 to 44 (a lower low on the oscillator), that is hidden bullish divergence. The trend is resuming. Compare that to a scenario where price makes a new high at 1.1000 but RSI peaks lower than it did at the prior high — that is regular bearish divergence, warning of a potential top.
How does RSI actually produce divergence signals?
RSI measures the ratio of average gains to average losses over a lookback period, typically 14 bars. When price pushes to a new extreme but the underlying buying or selling pressure is fading, RSI fails to confirm that extreme. That gap between price action and momentum is the divergence.
The 50 centerline matters more than most traders give it credit for. RSI above 50 means bulls are in control of the average session; below 50, bears are. A regular bearish divergence that forms with RSI still above 70 carries more weight than one where RSI barely reached 55 on the second peak. Similarly, a hidden bullish divergence where RSI holds above 50 throughout the pullback is a stronger signal than one where RSI dips to 35.
The 70/30 overbought-oversold bands add context but should not be treated as triggers. RSI can stay above 70 for extended periods in strong trends. Waiting for RSI to "come back from overbought" before acting on divergence is one of the most common timing errors.
Signal strength summary: Kraken's RSI divergence guide frames divergence as a warning to watch for confirmation from price itself, not a standalone entry trigger. That framing is exactly right.
According to forex-basics.com's analysis, hidden divergence carries an approximate hit rate of roughly two thirds when used with proper structure, while regular divergence runs somewhat lower. Those ranges come from practice-oriented analysis and will vary by market, timeframe, and confirmation rules. Use them as directional guidance, not guarantees.
How to spot valid RSI divergence on a chart
Reducing false positives starts with strict spotting rules. Most traders who lose money on divergence are comparing the wrong swings or acting on noise. Follow this sequence every time.
- Identify two clear, significant price swings. Both swings must be visually obvious, not micro-wiggles. On a 15-minute chart, a "swing" should span at least 8–10 bars and represent a meaningful move, not a two-candle stutter.
- Confirm the RSI swings are at least two bars apart. Per Alphaex Capital's execution guide, RSI peaks or troughs must be separated by a minimum of two bars to count as distinct swings. Single-bar spikes do not qualify.
- Draw trendlines on RSI peaks or troughs, then compare to price. Connect the two RSI highs (for bearish divergence) or two RSI lows (for bullish divergence) with a straight line. Do the same on price. If the slopes conflict, you have divergence.
- Apply the obviousness threshold. The RSI difference between the two swings should be at least 3–5 points. A 1-point difference is noise. Price should also show a clear directional move between the two swings, not a sideways chop.
- Check that both swings are in the same RSI zone. For regular bearish divergence, both RSI peaks should ideally be above 50 (preferably above 60). For regular bullish divergence, both RSI troughs should be below 50. Hidden divergence is less zone-dependent but should still respect the 50 centerline direction.
- Avoid divergences that span too many bars. A divergence stretching across 100+ bars on a daily chart may technically exist but has little timing value. Stick to divergences where the two swings are within a reasonable lookback window: roughly 20–60 bars on most timeframes.
On TradingView, draw your RSI trendlines directly on the indicator panel using the built-in drawing tools. The visual comparison between the RSI trendline slope and the price trendline slope is the core of the spotting process. Screenshot and annotate your setups before entering — this habit alone will cut impulsive trades significantly.
Which confirmation signals actually raise your win rate?
Divergence without confirmation is a hypothesis. Confirmation turns it into a trade. The goal is to require at least two confirming factors before entry, with one of them being a price-structure signal.
- Higher-timeframe trend alignment: The single most powerful filter. If you are trading a 15-minute hidden bullish divergence, the 1-hour or 4-hour trend should be pointing up. Trading against the higher-timeframe trend with regular divergence is lower probability and requires tighter stops.
- Trendline or structure break: Price breaking a short-term descending trendline or reclaiming a key support level after a bullish divergence is a strong structural confirmation. This is the price-action "vote" that the divergence is real.
- Reversal candlestick: A bullish engulfing, hammer, or pin bar at the divergence low adds a candle-close trigger. Forex-basics.com's RSI divergence strategy guide specifically recommends confirming with a reversal candle and placing the stop beyond the extreme that formed the divergence.
- Volume spike: A surge in volume at the divergence turning point suggests institutional participation. Thin-volume divergences in crypto or low-liquidity forex pairs fail more often.
- Secondary oscillator alignment: MACD histogram turning positive at a bullish divergence low, or Stochastic RSI crossing up from oversold, adds confluence without adding complexity.
Practical confirmation combos by setup type:
For a hidden bullish divergence scalp (5-minute chart, crypto): require the 15-minute trend to be up, a bullish engulfing candle at the divergence low, and RSI holding above 45 on the 5-minute. Three filters, fast execution.
For a regular bearish divergence swing trade (4-hour chart, forex): require the daily trend to be neutral or bearish, a trendline break below the most recent swing low, and a bearish close below a key resistance level. Fewer trades, higher conviction.
For swing setups, trend alignment and structure breaks are non-negotiable. For scalping, a reversal candle plus RSI zone is often sufficient, provided you keep stops tight and use volatility gating to avoid entering during news events.
Concrete strategy rules with two trade examples
A repeatable ruleset removes guesswork at the moment of execution. Here is the full framework.
- Entry trigger: Enter on the close of the confirmation candle, not before. Entering mid-candle on a divergence signal is one of the fastest ways to get stopped out on a wick.
- Stop placement: Place the stop beyond the swing extreme that formed the divergence, plus a buffer of 0.5 ATR (Average True Range) to avoid noise-driven stop-outs. For a bullish divergence, the stop goes below the price low. For bearish, above the price high.
- Position sizing: Risk 1–2% of total account equity per trade. Calculate position size from the distance between entry and stop, not from a fixed lot size.
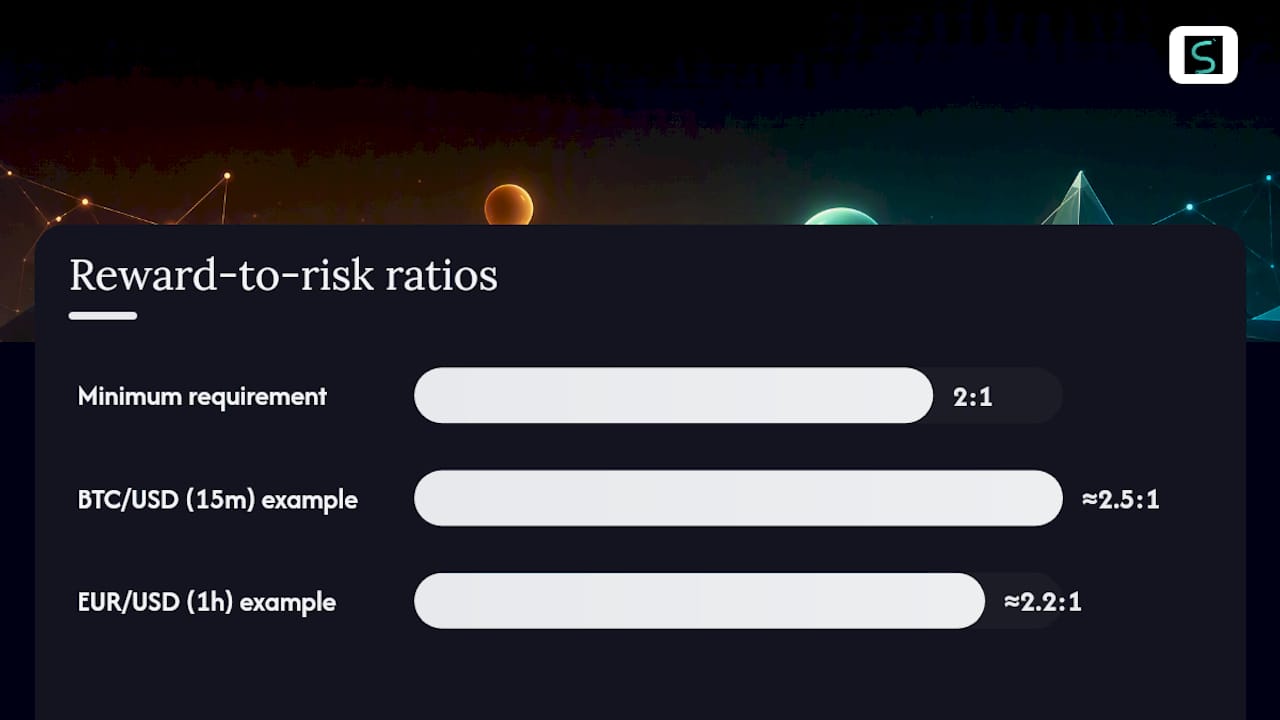
- Target rules: First target at the nearest swing high (for longs) or swing low (for shorts). Take partial profit (50%) there, move stop to breakeven, and let the remainder run to the next structural level. Minimum reward-to-risk of 2:1 before entering.
Trade Example 1: Hidden bullish divergence on BTC/USD (15-minute chart)
Setup: BTC is in a 4-hour uptrend. On the 15-minute chart, price pulls back from $68,500 to $67,200, forming a higher low relative to the prior swing at $66,800. RSI drops from 54 to 46 on this pullback, a lower low on the oscillator. Hidden bullish divergence confirmed. A bullish engulfing candle closes at $67,350. Entry: $67,350. Stop: $66,750 (below the swing low, plus 0.5 ATR buffer). First target: $68,500 (prior swing high). Risk-reward: approximately 2.5:1.
Trade Example 2: Regular bearish divergence on EUR/USD (1-hour chart)
Setup: EUR/USD has been rallying. Price prints a new high at 1.0980; RSI peaks at 68, lower than the prior peak of 74 when price was at 1.0940. Regular bearish divergence. A bearish engulfing candle closes below 1.0960. Entry: 1.0958. Stop: 1.0992 (above the price high, plus 0.5 ATR). First target: 1.0910 (nearest support). Risk-reward: approximately 2.2:1.
Pro Tip: For scalping on 1-minute to 5-minute charts, add a volatility gate: only take divergence signals when ATR is above its 14-period average. Low-volatility divergences in compressed ranges produce choppy, stop-hunting price action. When ATR is elevated, the follow-through on confirmed divergences tends to be cleaner and faster.
For a deeper look at position sizing and stop mechanics, the trader risk management checklist covers the full framework in detail.
How to backtest an RSI divergence strategy properly
Most traders skip backtesting and wonder why their live results do not match their expectations. A structured backtest answers the only question that matters: does this setup have a statistical edge?
Step-by-step methodology:
- Define your universe: one instrument, one timeframe, minimum 200 divergence signals for statistical relevance.
- Write out your exact signal rules before looking at any charts (RSI period, minimum bar separation, confirmation required, entry trigger, stop rule, target rule).
- Mark every qualifying divergence on historical data. Use TradingView's replay feature or export OHLCV data to a spreadsheet.
- Log each trade: entry price, stop, target, outcome (win/loss), R-multiple.
- Run a walk-forward test: optimize on the first 60% of your data, then validate on the remaining 40% without adjusting parameters.
- Forward-test on a demo account for at least three weeks before committing real capital.
Metrics to track:
| Metric | What it tells you | Minimum acceptable |
|---|---|---|
| Win rate | How often signals close profitably | 45% at 2:1 R:R |
| Average R:R | Reward relative to risk per trade | 2:1 or better |
| Expectancy | Average profit per trade in R-multiples | Positive (above 0) |
| Max drawdown | Largest peak-to-trough equity drop | Below 15% of account |
| Trades per month | Signal frequency on your timeframe | Enough to be statistically meaningful |
A win rate of 45% with a 2:1 average reward-to-risk produces a positive expectancy. That is a viable edge. Track both together, never in isolation.
For a more rigorous statistical framework when evaluating signal quality, the signal quality framework from Assymetrix offers useful methodology for thinking about edge and reliability across different signal types.
What RSI settings and timeframes work best for divergence?
The default RSI(14) is the right starting point for most traders. It balances responsiveness with noise reduction, and it is what the majority of TradingView users and institutional desks reference, which matters for self-fulfilling signal dynamics.
- RSI(14): Standard default. Works well on 1-hour, 4-hour, and daily charts for swing trading. Reliable divergence signals with moderate frequency.
- RSI(9) or RSI(7): Faster, more sensitive. Better suited for 5-minute to 15-minute scalping setups where you need earlier divergence signals. Produces more signals but also more noise.
- RSI(21) or higher: Slower, fewer signals. Useful for higher-timeframe confirmation on daily or weekly charts. Divergences here carry more weight but require patience.
Timeframe pairings that work in practice:
- Daily trend + 4-hour entries: the classic swing-trading combination. Spot the divergence on the 4-hour, confirm the daily trend direction, enter on the 4-hour confirmation candle.
- 1-hour trend + 15-minute entries: solid for active day traders. The 1-hour gives trend context; the 15-minute provides the precise entry trigger.
- 15-minute trend + 5-minute entries: the scalper's setup. Requires faster confirmation rules and tighter stops. ATR-based volatility gating is especially useful here.
- 1-minute to 5-minute scalping: RSI(7) or RSI(9) on the entry timeframe, with the 15-minute trend as the filter. High signal frequency, requires strict confirmation discipline.
For multi-timeframe RSI work on TradingView, the MTF RSI indicator lets you overlay RSI from a higher timeframe directly onto a lower-timeframe chart, so you can see both trend context and entry signal in one panel. This is one of the most practical setups for traders who want to apply multi timeframe RSI analysis without switching chart tabs constantly.
Minimum bar separation between RSI peaks or troughs: two bars is the floor, but five or more bars is where divergences become more meaningful. Smoothing the RSI with a signal line (some traders apply a 3-period EMA to RSI) can reduce false divergences in choppy conditions, though it introduces a slight lag on the entry signal.
For a broader look at how momentum indicators interact across timeframes, the momentum indicators guide on the Scalping-algo blog is worth reading alongside this.
Why RSI divergence fails and how to avoid the common traps
According to Pipcy's analysis, RSI divergence fails roughly 45% of the time, and the failure modes are predictable. Knowing them in advance is half the battle.
- Extended divergences in strong trends: Price keeps making new highs while RSI keeps printing lower highs, and the "reversal" never comes. The fix: do not act on regular bearish divergence in a strong uptrend without a clear structural break. Wait for price to actually break a support level before entering short.
- Divergences in choppy, range-bound markets: RSI oscillates back and forth, producing constant divergence signals that go nowhere. The fix: check the ADX (Average Directional Index). An ADX below 20 signals a non-trending market where divergence setups have much lower reliability. Skip them.
- Entering without structural confluence: A divergence that forms in open space, with no nearby support, resistance, or trendline, lacks the structural anchor that gives the setup its edge. The fix: require at least one structural level (prior swing, round number, moving average) near the divergence point.
Psychological traps to watch for:
- Confirmation bias: Once you spot a divergence, you start interpreting every candle as confirmation. The rule: define your confirmation criteria before you spot the divergence, not after.
- Overtrading: Not every divergence is worth trading. A divergence on a 5-minute chart during a low-volume pre-market session is not the same as one on a 1-hour chart during the London open. Filter by session, volume, and trend context.
- Impatience on the entry: Entering before the confirmation candle closes is the single most common execution error. The candle close is the rule. No exceptions.
For a broader list of execution errors that cost traders money, the beginner trading mistakes guide covers the psychological and mechanical traps in detail.
Your quick-reference checklist for every divergence trade
Print this. Paste it into your trading journal. Check every box before you click the entry button.
Spot conditions:
- Two clear, visually obvious price swings identified
- RSI swings at least two bars apart (five or more preferred)
- RSI trendline slope conflicts with price trendline slope
- RSI difference between swings is at least 3–5 points
Confirmations required:
- Higher-timeframe trend aligns with trade direction
- Structural level (support, resistance, trendline) near the divergence point
- Reversal candle or trendline break confirmed on close
Execution rules:
- Entry: on the close of the confirmation candle only
- Stop: beyond the swing extreme plus 0.5 ATR buffer
- Target: nearest swing high/low (first partial), next structural level (remainder)
- Position size: 1–2% account risk per trade, calculated from entry-to-stop distance
One-line trade template:
On TradingView, you can save this as a custom alert template and attach it to your divergence indicator so the alert fires with the setup details pre-filled. That removes the need to reconstruct the logic under pressure during live market hours.
The divergence signal most traders undervalue
Most retail traders gravitate toward regular divergence because it promises a reversal, and reversals feel exciting. The problem is that reversals are inherently lower-probability trades. You are betting against the prevailing momentum, which means you need tighter confirmation rules and faster exits.
Hidden divergence is the setup worth prioritizing. It aligns with the trend, it has a higher reported hit rate, and it gives you a natural stop placement at the pullback low, which is a structurally logical level. When you combine hidden bullish divergence on a 15-minute chart with a confirmed 1-hour uptrend and a volume spike at the pullback low, you are not fighting the market. You are joining it at a discounted entry.
The other undervalued insight: divergence quality degrades with timeframe compression. A divergence on a 1-minute chart is mostly noise. The same setup on a 1-hour chart is a meaningful signal. This does not mean you cannot scalp divergences on short timeframes, but it does mean your confirmation requirements need to be stricter, not looser, as you compress the timeframe.
One more thing that textbooks rarely say: the best divergence trades often feel uncomfortable at entry. The price is still moving against you when the confirmation candle closes. That discomfort is the signal that you are entering at a real inflection point, not chasing a move that has already happened. Trust the rules, not the feeling.
Scalping-algo's divergence tools map directly to this strategy
The ruleset in this article, from spotting hidden divergence to applying volatility gating and multi-timeframe confirmation, is exactly what Scalping-algo's premium TradingView indicator suite is built to automate. The Momentum Oscillator detects non-repainting divergence signals in real time, fires only when higher-timeframe trend conditions agree, and includes projected TP/SL levels so you are not calculating targets manually under pressure.

The Command Center dashboard consolidates backtesting results, live alerts, and educational materials in one place, so you can run the exact walk-forward test methodology described above without building a spreadsheet from scratch. Webhook alerts push directly to Discord, which means you capture signals even when you are not watching the chart. All scripts are open-source and built in Pine Script v6, so you can inspect the logic before trusting it with capital.
This is a paid subscription product. Before risking real money, backtest the indicator signals on paper or a demo account using the three-week forward-test protocol outlined above. Visit Scalping-algo to review the full indicator suite and membership options.
Sources
This article is general information, not a substitute for advice from a qualified financial advisor. Consult a qualified financial professional about your own circumstances before acting on anything here.