

Here's the setup: mark higher-timeframe bias, wait for a liquidity sweep at a key level, then trigger your entry on a lower-timeframe break of structure into a fair value gap or order block. That's the smart money scalping strategy in one sentence. Everything below is how to execute it without blowing up your account learning the hard way.
This isn't theory. It's the same three-gate logic institutional desks lean on, compressed into a 1 to 15 minute window and adapted for retail execution on TradingView. Trade only when trend, zone, and confirmation line up. Skip any gate and you're not trading anymore. You're gambling.
Run this checklist before every session:
- Bias check: confirm 1H/4H trend direction and mark the nearest untapped liquidity pool.
- Session window: trade the London open, the London-New York overlap, or the New York open. Skip the midday lull.
- Timeframe stack: 15m/5m for zone identification, 1m/3m for the confirmation trigger.
- Stop placement: beyond the swept wick or 1 to 1.5x ATR on the entry timeframe, whichever is tighter.
- Target sizing: 1R to 3R, scaled at the first liquidity pocket.
- Session limits: cap yourself at 3 to 5 trades and two consecutive losses before you shut the laptop.
Traders running this model on Scalping-Algo's indicator suite get the order block and fair value gap detection automated, which matters because manually spotting these zones in real time on a 1-minute chart during the New York overlap is genuinely hard. The rest of this guide walks through why each rule exists and how to build it into a system you can actually backtest.
Key Takeaways
The smart money scalping strategy works when a trader waits for higher-timeframe bias, a liquidity sweep, and a lower-timeframe structure shift to align before ever placing an order.
| Point | Details |
|---|---|
| Three-gate entry rule | Only enter when trend, zone, and confirmation all align; skipping one gate turns a trade into a guess. |
| Trade the overlap | The London-New York overlap offers the cleanest liquidity and volatility for scalping major pairs and indices. |
| Cap risk per session | Limit trades to 3 to 5 per session, stop after two consecutive losses, and risk 0.5% to 1% per trade. |
| Backtest before live | Validate expectancy across at least 100 trades with realistic slippage before risking real capital. |
| Automate zone detection | Scalping-Algo's non-repainting TradingView indicators mark order blocks and FVGs in real time, reducing manual identification errors. |
Table of Contents
- What Smart Money Scalping Strategy Requires Before You Start
- Which SMC Concepts Actually Matter for Scalping
- What Timeframes and Sessions Work Best for SMC Scalping?
- The Step-by-Step SMC Scalping Entry Model
- Position Sizing and Risk Math for Scalp Trades
- Managing a Live Scalp Trade From Entry to Exit
- How to Backtest and Journal Your Scalping Edge
- Three Annotated SMC Scalps in Action
- A Multi-Week Plan to Go From Demo to Live
- Verdict: Who Should Run This Model and What to Do Next
- What I've Learned Refining This Model
- How Scalping-Algo Helps You Execute This Strategy Faster
- Frequently Asked Questions
- Sources
What Smart Money Scalping Strategy Requires Before You Start
Not everyone should be scalping with Smart Money Concepts (SMC), and that's not a knock on the method. It's a timing and execution problem. Scalping compresses your decision window to seconds, and SMC adds a layer of structural reading that takes real screen time to internalize.
You need a baseline of experience before this pays off. If you've never watched price react to a liquidity level in real time, start on structure trading at higher timeframes first. Scalping punishes hesitation and rewards pattern recognition built from repetition, not from reading about it.
Trader profile requirements:
- At least three to six months of chart time on any strategy, so you're not learning candle behavior and SMC vocabulary simultaneously.
- Minimum capital that lets you risk 0.5% to 1% per trade without the dollar amount distorting your decisions. For most retail accounts, that means starting north of $2,000 to $5,000 so position sizing doesn't force you into odd lots or unworkable stop distances.
- A genuine tolerance for slippage and imperfect fills. Scalping on 1m to 5m charts means you will get worse fills than your backtest sometimes, and that has to be priced into your expectations, not treated as a system failure.
Technical setup you need in place:
- A TradingView account with at least the Plus tier, so you can run multiple indicators and set alerts across timeframes without hitting limits.
- Chart layouts prebuilt for 1m, 5m, 15m, and 1H, saved so you're not rebuilding your workspace mid session.
- A broker with sub 1 pip spreads on major pairs and execution speeds under 100 milliseconds. If your broker requotes often, scalping SMC setups becomes a fight against your own fills, not the market.
Operational prerequisites:
- Decide in advance whether you're using limit orders (better fills, risk of missing the move) or market orders (guaranteed entry, worse fills during volatility).
- Automate your stop-loss. Manual stop management during a fast 1-minute move is where most scalping accounts die.
- Build a demo-to-live ramp: a minimum of 100 demo trades logged before committing real capital, then a reduced-size live phase before scaling up.
Pro Tip: Test your broker's actual slippage before you trust any backtest. Place ten market orders during the New York open on a demo account, log the difference between requested and filled price, and use that number to adjust your minimum stop distance. A backtest that assumes zero slippage on a strategy targeting 8 pip stops is fiction.
Which SMC Concepts Actually Matter for Scalping
Most retail traders drawing order blocks on a 1-minute chart are marking noise, not institutional footprints. The concepts themselves are precise. The problem is application at low timeframes without discipline.
Order blocks (OB): the last down candle before an aggressive up move (bullish OB) or the last up candle before an aggressive down move (bearish OB). On a 1H chart, this is usually obvious. On a 1-minute chart, you'll see dozens of candles that superficially qualify. The filter that matters: the move away from the OB needs to break a prior structural high or low, not just look like a strong candle.
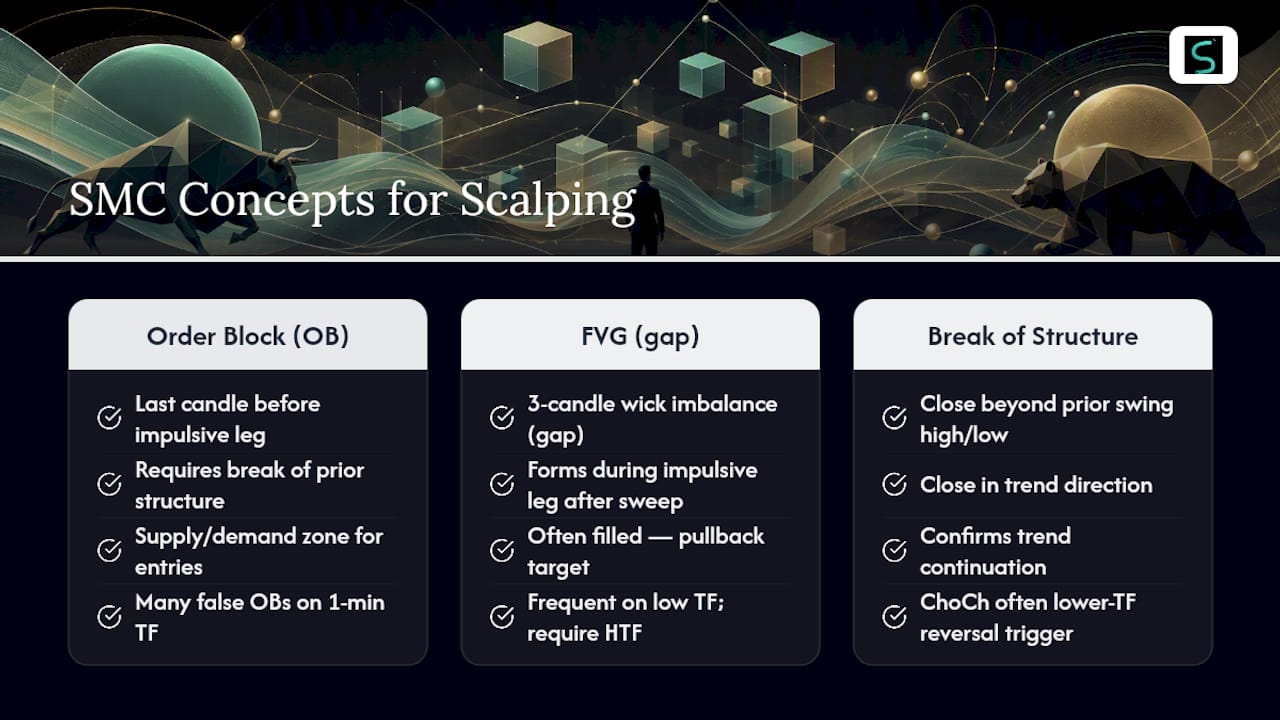
Fair value gaps (FVG): a three-candle imbalance where the wick of candle one and the wick of candle three don't overlap, leaving a gap in price that the market often returns to fill. On lower timeframes, FVGs form constantly. Only trade the ones aligned with your higher-timeframe bias and formed during the actual expansion move off a liquidity sweep, not random mid-range chop.
Break of structure (BOS): price closes beyond a previous swing high or low in the direction of the existing trend, confirming continuation.
Change of character (ChoCh): price breaks structure against the prevailing trend, the first sign of a potential reversal. ChoCh is your lower-timeframe confirmation trigger far more often than BOS in a reversal scalp setup.
Liquidity pools and liquidity grabs: clusters of stop orders sitting above swing highs or below swing lows. A liquidity grab is a sharp wick through that level, followed by rejection, which signals the sweep has done its job of triggering retail stops before the real move.
The framework that separates a systematic entry from a guess is simple: trend, zone, and confirmation all have to align. Skip any one gate and the trade becomes a target instead of a setup.
The most common misread among retail scalpers is calling every sharp candle an "order block" or every gap an "FVG" worth trading. A real OB should precede a structural break. A real FVG should form during the impulsive leg off a liquidity sweep, not during consolidation. If you can't point to the liquidity event that preceded the zone, you're probably looking at noise.
TradingView indicators, including the Scalping-Algo suite, automate this identification by marking non-repainting OBs and FVGs directly on the chart, which removes a huge chunk of the subjective guesswork that trips up newer SMC scalpers.
What Timeframes and Sessions Work Best for SMC Scalping?
Read bias on the 1H or 4H chart. Identify your trade zones on the 15m or 5m chart. Trigger entries on the 1m or 3m chart. That's the mapping, and deviating from it is where most scalpers get lost, jumping straight to a 1-minute chart with no higher-timeframe context.
The 1H chart tells you whether you're a buyer or a seller today. It also flags the nearest untapped liquidity, usually the prior day's high or low, an Asian session range, or a swing point from the last few sessions. The 15m and 5m charts narrow that down to the specific order block or FVG you're watching. The 1m or 3m chart is purely for the trigger: the exact candle close that confirms MSS or ChoCh and gives you a defined entry and invalidation.
Session windows, ranked by tradability:
- London open (3:00 to 5:00 AM ET): strong volatility, especially on GBP and EUR pairs, but wider spreads early in the session.
- London-New York overlap (8:00 to 11:00 AM ET): the highest-volume window of the trading day and generally the best liquidity for scalping major FX pairs and US indices.
- New York open (9:30 to 10:30 AM ET): particularly strong for scalping S&P 500 and Nasdaq futures, since overnight accumulation and opening order flow tends to produce a cleaner sweep-shift-imbalance sequence than midday sessions.
Avoid scalping during the New York lunch lull (roughly noon to 1:30 PM ET), the hour before major news releases like CPI or FOMC, and session transition windows where liquidity thins out and spreads widen unpredictably.
Pro Tip: Match the instrument to the session, not the other way around. Major FX pairs (EUR/USD, GBP/USD) scalp best during London and the overlap. US index futures and large-cap stocks scalp best around the New York open and close. Crypto trades around the clock but still shows cleaner structure during the overlap, when both traditional and crypto-native liquidity providers are active.
The Step-by-Step SMC Scalping Entry Model
This is the sequence, run in order, every single time. No shortcuts, no "it feels right" entries.
- Check HTF bias. Pull up the 1H or 4H chart. Identify the prevailing trend and the nearest untapped liquidity pool above or below current price.
- Identify the zone. Drop to the 15m or 5m chart and mark the order block, FVG, or liquidity confluence area that aligns with your bias.
- Wait for the sweep. Price needs to run through the liquidity level, wicking beyond it and rejecting, before you do anything.
- Confirm on the LTF. Move to the 1m or 3m chart and wait for a market structure shift, either a BOS confirming continuation or a ChoCh confirming reversal, on a closed candle.
- Enter. Place your order on the confirmation candle's close or the immediate retest of the broken structure level.
- Set stop and target. Stop goes beyond the swept wick or 1 to 1.5x ATR on your entry timeframe. Target the next liquidity pocket at 1R to 3R.
Entry rules that separate a real signal from a hopeful guess:
- The confirmation candle must close beyond the prior structure point, not just wick through it.
- Look for elevated relative volume (RVOL above 1.5x the 20-period average) on the confirmation candle. A structure shift on dead volume is far less reliable.
- Never enter before the confirmation timeframe candle closes. Entering mid-candle on an unconfirmed move is the single most common way scalpers get faked out.
On execution mechanics: limit orders at the retest give you better pricing but risk missing fast moves; market orders guarantee the fill but cost you a few extra pips of slippage during volatile windows. Size your position for the fill you'll actually get, not the one you hope for. Cap yourself at one open position per instrument, and never average into a losing scalp. That's not "trade management," that's turning a defined-risk trade into an undefined one.
A copy-paste checklist for your TradingView notes or the Scalping-Algo Command Center:
- HTF bias confirmed and liquidity target marked
- Zone identified on 15m/5m (OB, FVG, or confluence)
- Liquidity sweep observed and rejected
- LTF confirmation candle closed beyond structure
- RVOL above threshold on confirmation candle
- Stop and target calculated before order placement
Position Sizing and Risk Math for Scalp Trades
Scalping without a sizing formula is how accounts get wiped out in an afternoon. The math is not complicated, but it has to be done before every trade, not after.

Fixed fractional sizing is the simplest approach: decide your risk per trade as a percentage of account equity (0.5% to 1% is standard for scalping), then divide that dollar risk by your stop distance in pips or ticks to get position size.
Formula: Position size = (Account equity × Risk %) ÷ Stop distance in pips (or ticks) × Pip value
ATR-based sizing adjusts your stop distance to current volatility instead of a fixed pip count, which matters because a 5 pip stop that works fine in a quiet session gets stopped out constantly during a volatile New York open.
Here's what that math looks like across a few account sizes, assuming a 1% risk per trade on EUR/USD:
Spread, commission, and slippage eat directly into your realized R multiple. That's why scalping viable stops rarely go below 5 to 8 pips on major FX pairs unless your broker offers genuinely tight raw spreads.
Daily and session risk caps that actually protect capital:
- Max loss per trade: 0.5% to 1% of account equity, no exceptions.
- Max loss per day: 2% to 3% of account equity, then you're done regardless of setup quality.
- Max consecutive losses before stopping: two. If your first two trades both stop out, the session's conditions likely don't match your model. Stop and reassess rather than pushing for a third entry.
These caps aren't arbitrary. A disciplined pre-trade checklist paired with hard session limits materially reduces the risk of ruin for scalpers running SMC-based systems, because the strategy's edge comes from selectivity, not volume of trades.
Managing a Live Scalp Trade From Entry to Exit
Getting the entry right is half the job. What you do after you're in the trade determines whether your win rate translates into actual profit.
For scalps in the 1 to 15 minute window, a fixed take-profit at your predetermined 1R to 3R target is usually cleaner than a discretionary trailing stop. Trailing stops sound appealing but often get you out of winning trades early on the noisy micro-pullbacks that are normal on a 1-minute chart. Reserve dynamic trailing for setups where you have a clear runner thesis, like a strong continuation move breaking through multiple liquidity levels in a trending session.
A practical partial-exit framework:
- Take 50% off at 1R, and move your stop to break-even immediately after.
- Let the remaining 50% run toward 2R to 3R, trailing behind the most recent 1-minute swing low or high.
- If price stalls for more than three to five candles without progressing toward your target, close the runner. Scalping isn't the timeframe for patience beyond a few minutes.
Mistakes that quietly destroy scalping accounts:
- Over-trading during choppy, low-volume windows just to stay busy.
- Moving a stop further away "to give it room" after the trade goes against you. This is the single fastest way to turn a defined 1% risk into a 3% or 4% loss.
- Revenge trading immediately after a loss, chasing a setup that doesn't actually meet your three-gate checklist.
Automating what you can removes emotion from these decisions. Pre-set OCO (one-cancels-other) orders with your stop and target attached at entry, so there's no manual intervention required mid-trade. Some scalpers use webhook alerts tied to their indicator suite to flag when a trade has hit break-even territory, prompting a stop adjustment without needing to babysit the chart.
Pro Tip: Place your limit orders slightly inside the actual OB or FVG boundary rather than at the exact edge. Institutional zones often get one wick through before the real reaction, and entering a few ticks inside the zone reduces the odds of a bad fill on a level that gets briefly violated before holding.
How to Backtest and Journal Your Scalping Edge
An SMC scalping strategy that hasn't been backtested is a hypothesis, not a system. The backtest process needs to be as rigorous as the entry rules themselves, or you're just fooling yourself with hindsight bias.
- Define your rules in writing before you look at a single chart. Every gate (bias, zone, confirmation) needs an unambiguous, checkable condition. If you can't write the rule down precisely enough for someone else to follow it, it's not testable.
- Select your sample. Pull at least 100 historical setups across a mix of trending and ranging conditions, ideally spanning three to six months, so you're not just backtesting one market regime.
- Simulate realistic fills. Add slippage of 1 to 2 pips on entries and assume you don't get filled on every limit order, especially during fast liquidity sweeps.
- Record every outcome, win or loss, including the R multiple achieved, not just win/loss binary.
- Sanity-check your assumptions against live micro-testing. Run 20 to 30 trades on a demo account using the exact backtested rules and compare the live win rate and average R to your backtest numbers.
Metrics that actually tell you whether the edge is real:
- Expectancy: (Win rate × Average win) minus (Loss rate × Average loss). This single number tells you more than win rate alone ever will.
- Average R per trade: are your winners actually hitting 1.5R to 2R on average, or are you cutting winners short out of nerves?
- Max drawdown: the worst consecutive losing streak in your sample, in both dollar terms and percentage of account.
- Trade frequency per session: how many valid setups actually appear during your chosen session window, which tells you whether the strategy can scale to your desired trade volume.
Minimum sample size before trusting the numbers: 100 trades. Fewer than that and you're looking at noise, not an edge.
Journal template, per trade:
- Screenshot of the setup at entry (with HTF bias, zone, and confirmation candle marked)
- Indicator readings at the time of entry
- Entry price, stop, target, and actual exit price
- Decision rationale in one sentence: why this trade met all three gates
Statistic Callout: A 1-minute SMC system tested with strict session limits (3 trades max, 2 daily losses max) and 1R to 3R targets is built specifically around expectancy discipline rather than raw win rate, meaning a 40% win rate paired with consistent 2R winners still produces a positive expectancy system.
Three Annotated SMC Scalps in Action
Seeing the model applied to real chart conditions makes the abstract rules concrete. Here are three setup types, each representing a different market condition scalpers regularly encounter.

Trending continuation scalp (EUR/USD, London-New York overlap): 1H bias showed a clean uptrend with price holding above a rising structure. On the 5m chart, price pulled back into a bullish order block that lined up with a 15m FVG. The Scalping-Algo indicator suite flagged the OB automatically with a non-repainting marker, and the 1m chart showed a BOS confirmation candle on elevated volume. Entry was placed on the retest of the broken 1m structure, stop below the OB low, target at the next 15m liquidity pocket for a favorable risk-reward outcome.
Liquidity reversal scalp (Nasdaq futures, New York open): Price had been grinding upward into a prior session high, an obvious liquidity magnet. The 1H chart showed early signs of exhaustion. Price wicked through the high, sweeping stops, then reversed sharply. On the 1m chart, a ChoCh confirmed the shift, with the Scalping-Algo divergence tool flagging a bearish reading at the exact sweep point. Entry triggered on the ChoCh candle close, stop above the swept high, target at the FVG formed during the initial move up, for a 1.8R result.
Open-session scalp (S&P 500 futures, New York open): Index scalps at the open tend to reward patience for the initial sweep before committing. Pre-market liquidity sat just below the overnight low. At the open, price swept that low, then rapidly shifted structure on the 3m chart. Confirmation came with a strong bullish engulfing candle closing above the prior 3m swing high. Entry on the retest, stop below the sweep wick. First target at 1R with 50% scaled off, runner closed manually after stalling near 2.1R.
Condensed backtest summary across these three setup types (100-trade sample, 1 to 2 pip slippage assumed):
Statistic Callout: Across all three setup types combined, the blended expectancy sits at roughly 0.44R per trade under conservative slippage assumptions, meaning a trader executing 15 valid setups per week could reasonably expect a positive equity curve even with a sub-50% win rate, provided execution discipline holds.
A Multi-Week Plan to Go From Demo to Live
Rushing to live trading before the model is internalized is the fastest path to giving back months of progress in a single bad week. Build this in stages.
- Weeks 1 to 2, study phase: review 50 historical chart examples of the three-gate setup without placing a single trade. Mark bias, zone, and confirmation on each. Build pattern recognition before risking anything.
- Weeks 3 to 4, demo drills: run a minimum of 50 setups per session across two weeks on a demo account. Screenshot every trade, win or loss, and log it in your journal template.
- Weeks 5 to 6, structured backtesting: formalize the 100-trade backtest described earlier, using your actual demo results as part of the sample. Calculate expectancy and average R.
- Weeks 7 to 8, limited-live sizing: go live with 0.25% risk per trade, roughly a quarter of your eventual target size. The goal here isn't profit, it's confirming your execution holds up when real money is on the line.
- Week 9 onward, full-live ramp: increase to your full risk percentage only after your limited-live phase matches your backtested expectancy within a reasonable margin.
Transition triggers, decided in advance: increase size only after 30 consecutive live trades at your current risk level show expectancy consistent with your backtest. Decrease size or pause entirely if you hit your max daily loss cap three sessions in a row, a signal that either market conditions have shifted or your execution has drifted from the rules.
Pro Tip: Markets change regimes. A model tuned for a trending environment will underperform in a choppy range, and vice versa. Revisit your backtest quarterly, segment results by trending versus ranging conditions, and adjust your setup selectivity rather than abandoning the framework entirely when performance dips.
Verdict: Who Should Run This Model and What to Do Next
This strategy fits traders who already have baseline chart experience, the temperament to sit on their hands through two or three gates before entering, and the capital to size positions without emotional distortion. It does not fit anyone looking for a shortcut around screen time or looking to trade every candle that moves.
Your next four steps, in order:
- Build your 1m/5m/15m/1H chart layout on TradingView and save it as a template you reuse every session.
- Run a 100-trade demo sample using the exact three-gate checklist before risking real capital.
- Configure the Scalping-Algo indicator suite to auto-mark order blocks, FVGs, and structure shifts, so identification stops being the bottleneck.
- Join a live practice session or community walkthrough to see the model applied in real time by other traders running the same framework.
Before any of that, do the risk math from the position sizing section on your actual account size. A strategy with strong expectancy on paper still fails if your risk per trade is too large for your account to survive a normal losing streak.
What I've Learned Refining This Model
The biggest mistake I see traders make with smart money concepts scalping isn't misreading an order block. It's treating every session as tradable. The framework works because it's selective, and most traders can't tolerate sitting through a slow London morning waiting for a real liquidity sweep instead of forcing a trade on a mediocre setup.
The habit that changed my results more than any indicator tweak was writing the invalidation level down before entering, not after. When your stop is decided in advance and tied to a structural level rather than a comfortable dollar amount, you stop negotiating with yourself mid-trade. That single change cuts the "just give it a little more room" impulse that turns a clean 1% loss into a 3% one.
I run indicator alerts through the Command Center so I'm not staring at four chart windows during the overlap, hoping I catch the sweep in real time. The alert fires on the liquidity grab, I pull up the 1m confirmation, and I either see the ChoCh or I don't. No confirmation, no trade, regardless of how good the setup looked ten minutes earlier.
On psychology: I enforce a hard rule that two losses ends the session, full stop, no exceptions for "one more good setup." Every account blow-up story I've heard from other scalpers traces back to ignoring that exact rule on a day that felt different. It never actually is.
How Scalping-Algo Helps You Execute This Strategy Faster
Manually spotting order blocks, fair value gaps, and liquidity sweeps across four timeframes in real time is the hardest part of this entire strategy, and it's exactly where most scalpers lose the trade before they ever place an order. Scalping-Algo removes that bottleneck with non-repainting TradingView indicators built in Pine Script v6 that mark these zones automatically, so you're reacting to a confirmed signal instead of second-guessing a hand-drawn box.

The indicator suite covers order block and FVG detection, divergence signals, and volatility gating across crypto, forex, indices, and futures, all optimized for the 1m to 15m windows this strategy runs on. The built-in backtesting dashboard lets you validate your own rule set against historical data with slippage assumptions baked in, instead of guessing whether your expectancy math holds up. Webhook alerts push signals straight to Discord, so you catch the liquidity sweep and confirmation trigger without staring at four chart windows during the overlap.
If you're ready to stop manually marking zones and start executing on confirmed signals, set up the full indicator suite and run it alongside your next demo session.
Frequently Asked Questions
What is the smart money scalping strategy? It's a scalping method that applies Smart Money Concepts, higher-timeframe bias, liquidity sweeps, and structure shifts like BOS and ChoCh, to lower timeframe charts (1m to 15m) for fast, repeatable entries with defined risk.
What timeframes work best for SMC scalping? Use 1H or 4H for bias, 15m or 5m for zone identification, and 1m or 3m for entry confirmation. This three-tier mapping keeps you trading with structure instead of reacting to noise on a single chart.
How many trades should a scalper take per session? Cap yourself at 3 to 5 trades per session and stop after two consecutive losses. More trades usually means you're forcing setups that don't meet the full three-gate checklist.
What's the difference between an order block and a fair value gap? An order block is the last opposing candle before an aggressive structural move. A fair value gap is a three-candle price imbalance the market often revisits. Both matter more when they form during an impulsive move off a liquidity sweep rather than during random chop.
Can this strategy work in stocks and crypto, not just forex? Yes, the same three-gate logic applies across asset classes. Session timing shifts (US market hours for large-cap stocks, the overlap for crypto's cleanest structure), but the bias-zone-confirmation sequence stays the same.
How do I know if my SMC scalping edge is real? Backtest at least 100 trades with realistic slippage assumptions and calculate expectancy, not just win rate.
This article is general information, not a substitute for advice from a qualified financial advisor. Consult a qualified financial professional about your own circumstances before acting on anything here.
Sources
A few resources go deeper into specific pieces of this framework if you want to build out your own rule set further.
- How To Trade & Scalp Indices at the Open Using Smart Money Concepts (SMC)
- SMC Trading Framework: Trend, Zone & Confirmation Entries — Oyamori
- 1-Minute Forex Scalping Strategy Guide | PDF