
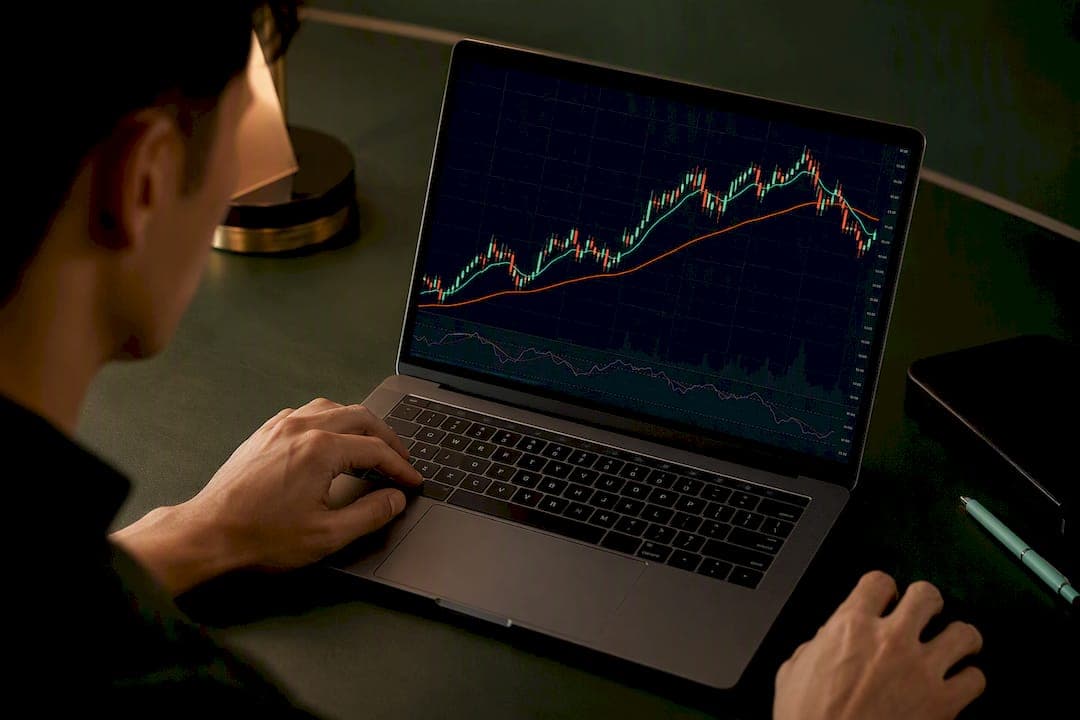
The Adaptive Moving Average, known as Kaufman's AMA or KAMA, automatically tightens during trends and smooths out during noise by weighting price movement with an Efficiency Ratio. It's built for traders who want less lag in a clean trend without getting whipsawed every time price stalls. Use it to ride directional moves. Don't rely on it alone in a choppy, range-bound market. It'll lag there too, just less predictably.
TL;DR:
- AMA performs best in trending markets with high efficiency ratio values, but can provide false signals in sideways or range-bound conditions.
- Using a lookback N of 8 to 10 bars benefits scalpers on shorter timeframes, while swing traders may prefer N values between 15 and 20 for stability.
- Squaring the scaled smoothing constant enhances AMA's responsiveness, making it react more sharply during strong trends than a linear approach.
- Combining AMA signals with volatility filters or multi-timeframe confirmation reduces false entries and whipsaws in choppy markets.
- Tuning AMA parameters requires extensive backtesting on the specific instrument, as overfitting to past data diminishes real-world effectiveness.
Table of Contents
- What Is an Adaptive Moving Average and Why Does It Exist?
- How to Calculate AMA: Efficiency Ratio, SSC, and the Recurrence Formula
- How Do You Read AMA Signals on a Chart?
- What Settings and Timeframes Work Best for AMA?
- What Are the Limitations and Common Pitfalls of AMA?
- A Practical Checklist for Testing AMA on Any Instrument
- Ready-Made Adaptive Indicators for Traders Who'd Rather Not Code
- Sources
- FAQ
What Is an Adaptive Moving Average and Why Does It Exist?
Perry Kaufman built AMA to solve a problem every trader knows: a fast moving average catches trends early but chops you up in sideways action, while a slow one smooths the noise but shows up late to the party. AMA splits the difference by adjusting its own speed based on market behavior.
The mechanism runs on the Efficiency Ratio, which measures how directly price is moving versus how much it's bouncing around to get there.
- When ER is near 1, the market is trending cleanly. AMA speeds up to hug price.
- When ER is near 0, price is churning sideways. AMA slows down and flattens out.
- AMA helps most in trending regimes and does its worst work in tight, noisy ranges where ER keeps flipping.
That's the whole idea. One line, two speeds, and a formula that decides which speed to use in real time.
How to Calculate AMA: Efficiency Ratio, SSC, and the Recurrence Formula
Kaufman's math isn't complicated once you break it into three steps. Here's the sequence:
- Calculate the Efficiency Ratio. Signal equals the absolute price change over N bars:
|Price(i) - Price(i-N)|. Noise equals the sum of every absolute bar-to-bar change over that same window:sum(|Price(j) - Price(j-1)|). Divide signal by noise to get ER, a value between 0 and 1. - Derive the Scaled Smoothing Constant.
SSC(i) = ER * (fastSC - slowSC) + slowSC. This stretches ER across the range between your fast and slow smoothing constants. - Square the SSC. Kaufman recommends squaring SSC before applying it, which widens the gap between trending and ranging behavior instead of leaving it linear.
- Run the recurrence.
AMA(i) = AMA(i-1) + (SSC(i)^2) * (Price(i) - AMA(i-1)).
The squared SSC is the detail most retail explanations skip, and it's why AMA reacts more sharply than a straight-line blend of ER would suggest. For the first bar, most implementations seed AMA with the current closing price or a simple average of the first N bars. Get that seed wrong on a low N setting, and your early readings will be unreliable until enough bars roll through.
How Do You Read AMA Signals on a Chart?
Once AMA is plotted, reading it comes down to three checks: slope, crossovers, and the ER value driving it.
- Slope first. A rising AMA with price sitting above it points to a bullish trend. A falling AMA with price below it points to bearish continuation.
- Crossovers second. Price crossing above or below AMA can flag an entry, but confirm it with slope direction. A crossover against a flattening AMA is a weaker signal than one riding a clear tilt.
- Dual-AMA setups. Some traders run a fast AMA against a slower one and treat the cross between them like a MACD-style signal.
- ER as a filter. An ER reading above a moderate threshold suggests real directional strength; lower ER readings often indicate choppy markets, so caution is warranted when signals occur in these ranges.
Combining AMA with a volatility read or volume confirmation cuts down on false signals, since AMA alone can still slope gently during a low-conviction drift.
Pro Tip: Watch the ER value directly instead of just eyeballing the AMA line. A flattening AMA with ER creeping toward zero is your market telling you to stand aside, not a bug in the indicator.
What Settings and Timeframes Work Best for AMA?
Most platform defaults set the fast smoothing constant near 2 (equivalent to a 2-period EMA) and the slow constant near 30, which MetaTrader 5's documentation confirms as the standard starting point. Those two numbers set the ceiling and floor AMA swings between as ER shifts.
- Pick your ER lookback (N) by timeframe. Scalpers on 1 to 5 minute charts often shrink N to 8 to 10 bars for faster ER response; swing traders on 4 hour or daily charts tend to stretch N to 15 to 20 for a steadier read.
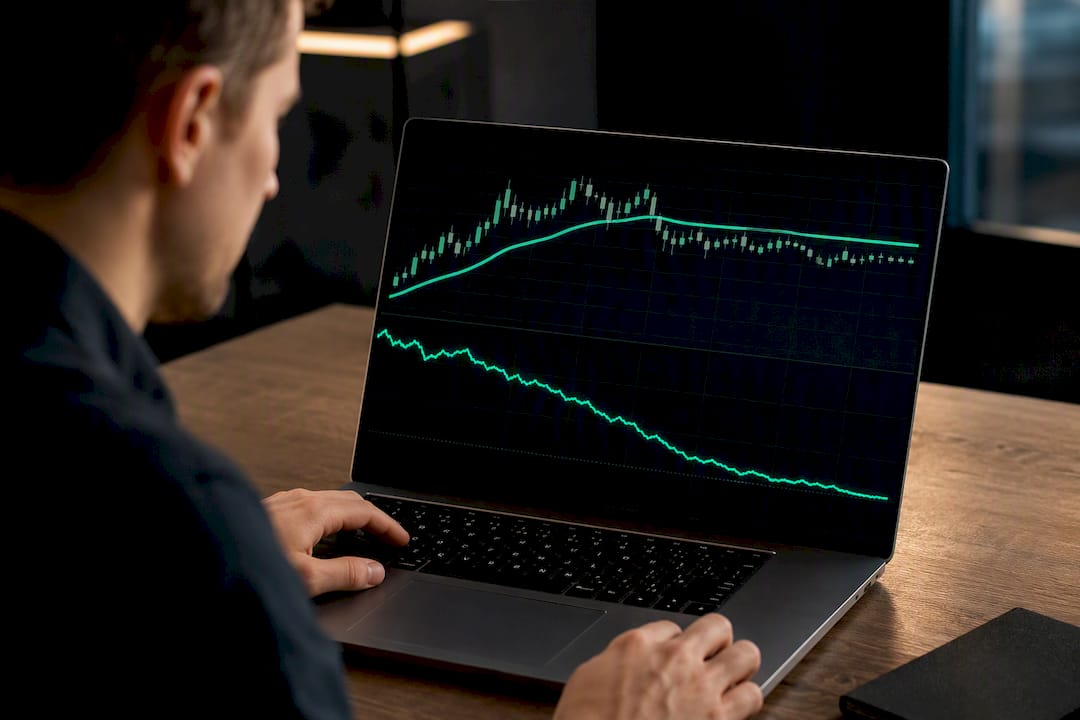
- Test responsiveness across three settings. A 10 period ER window will hug volatile intraday swings; a 20 period window smooths those same swings into a cleaner but slower line; a 30 period window barely reacts to anything short of a sustained move.
- Run a backtesting checklist. Check win rate against a large enough sample, not 20 trades, along with average trade size and maximum drawdown before trusting any parameter set live.
Our adaptive trading parameters guide for scalpers breaks down specific N and SC combinations if you're building this out for lower timeframes.
What Are the Limitations and Common Pitfalls of AMA?
AMA is still a lagging indicator. It reduces lag relative to a fixed-period moving average, but it can't call an exact top or bottom, a point Investopedia's analysis of adaptive moving averages makes clear when comparing adaptive methods against static ones.
- Sideways markets can produce a misleadingly high ER for a few bars right before price stalls again, tricking AMA into speeding up at the worst moment.
- Overfitting is the silent killer here. Tuning fastSC, slowSC, and N to make historical trades look perfect almost guarantees underperformance on new data.
- Prefer out-of-sample testing over curve-fitting a single chart's history.
- Pair AMA with multi-timeframe confirmation, a volatility gate, and fixed position sizing rules rather than trusting one line to carry the whole decision.
Our why monitor market volatility guide covers how volatility gating specifically cuts down on the whipsaw problem.
A Practical Checklist for Testing AMA on Any Instrument
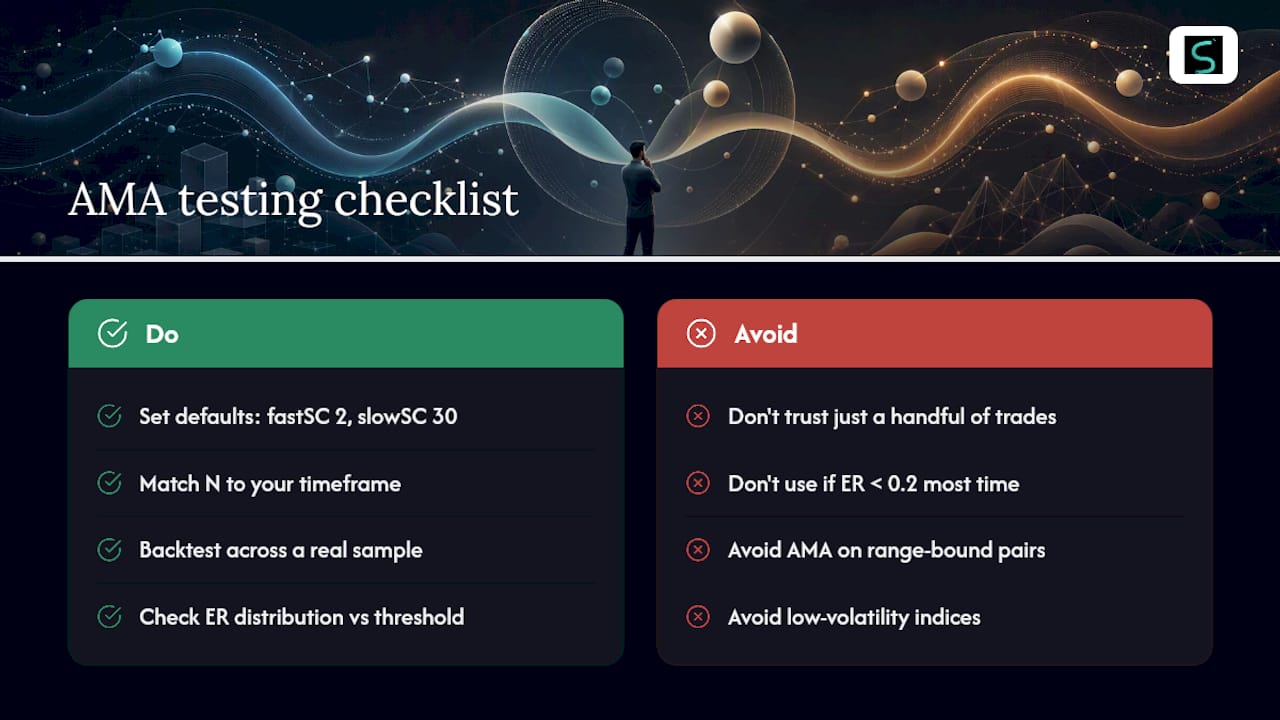
Before trusting AMA on a live chart, run it through a short sequence: set the standard defaults (fastSC 2, slowSC 30, N matched to your timeframe), backtest across a real sample, then pull up the ER distribution to see how often the market you're trading actually sits above your directional threshold.
If ER spends most of its time below 0.2 on that instrument, AMA won't earn its keep there. Paper trade for a minimum stretch, not a handful of trades, before risking size. In practice, AMA earns its place over a plain EMA on instruments that trend in bursts and go quiet in between. Range-bound pairs or low-volatility indices often don't reward the extra complexity.
— Tran
Ready-Made Adaptive Indicators for Traders Who'd Rather Not Code
Coding Kaufman's formula from scratch in Pine Script works, but it takes real testing time to get the ER window, SSC squaring, and seed handling right before you'd trust it with capital.

Scalping-Algo's indicator suite skips that build phase. Every signal runs on adaptive parameters similar in spirit to AMA, tuned for lower timeframes and delivered non-repainting, so what you see on the chart is what would have actually triggered a trade. The Command Center dashboard bundles backtesting, live alerts, and Discord webhook delivery so you can validate a parameter set against real history before committing to it live, instead of guessing from a demo account. For traders who want the confirmation layer that pairs well with adaptive averages, the trend confirmation indicator adds a second check against false crossovers. Run a backtest on the Algo Master suite against your usual instrument this week and compare the signal timing against whatever moving average setup you're using now.
Sources
For formula verification, check MetaTrader 5's AMA documentation, the MQL5 code reference, CQG's AMA help page, and NIST's exponential smoothing handbook for the underlying smoothing constant theory.
- Adaptive Moving Average - Trend Indicators (MetaTrader 5)
- Adaptive Moving Average (AMA) - indicator for MetaTrader 5
- Do Adaptive Moving Averages Lead To Better Results? (Investopedia)
FAQ
Is a 20 EMA or 50 EMA Better for Trading?
Neither is universally better. A 20 EMA reacts faster and suits shorter-term swing entries, while a 50 EMA smooths more and works better for confirming a longer trend; many traders run both together rather than picking one.
Is EMA or a Simple Moving Average Better?
EMA weights recent price more heavily, so it reacts faster to new information than a simple moving average, which makes it more useful for timing entries. A simple moving average still has value for spotting broader, slower-moving trend structure.
What Is a Good EMA Setting for Stocks?
Common defaults include periods like 20 for EMAs, chosen based on whether you're trading short-term momentum or tracking a longer institutional trend. There's no single correct number since it depends on your holding period and the stock's typical volatility.
What Are the Drawbacks of Using EMA?
EMA still lags price because it's built from past data, and it can generate false signals during choppy, sideways markets just like any moving average. Kaufman's AMA was specifically designed to reduce that lag problem by adjusting its own speed with the Efficiency Ratio instead of using a fixed weighting.
Does Scalping-Algo Offer Adaptive Indicators for Lower Timeframes?
Yes, Scalping-Algo's premium indicator suite includes adaptive, non-repainting signals built for 1 to 15 minute charts, along with a backtesting dashboard to validate parameter choices before trading live.