

Backtesting trading strategies is the process of applying a set of fixed trading rules to historical market data to measure statistical performance before risking real capital. Every serious trader in Forex, crypto, and stocks uses this method to separate ideas that work from ideas that just feel right. Knowing how to backtest trading strategies correctly means understanding data quality, execution costs, and validation methods that go beyond a simple profit curve. This guide covers each step, from tool selection to walk-forward testing, so you can build confidence in any strategy before you go live.
What essential tools and data do you need for backtesting?
The right tools determine how honest your backtest results will be. Backtesting platforms vary widely from manual chart replay to automated Python libraries, with real trade-offs in speed, flexibility, and accuracy. Choosing the wrong one leads to results you cannot trust.
Three main platform types
Manual backtesting uses chart replay software or a spreadsheet to simulate trades one by one. It is slow but forces you to see every trade clearly. This method works well for swing traders testing simple setups on daily or weekly charts.

Spreadsheet-based backtesting uses tools like Microsoft Excel or Google Sheets to log trades and calculate metrics. You pull historical data manually, apply your rules, and record outcomes. It gives you full control over calculations but scales poorly beyond a few hundred trades.
Automated backtesting uses coding environments or dedicated platforms to run thousands of trades in seconds. Automated testing enables rapid sensitivity analysis and walk-forward validation, which manual methods cannot match at scale.
Data quality is non-negotiable
Clean, tick-level or minute-level historical data is the foundation of any reliable backtest. For Forex traders, understanding historical FX data preparation is critical because gaps, errors, and adjusted prices corrupt results. For crypto, use exchange-specific OHLCV data that reflects actual trading hours and liquidity conditions.
- Use data from the same exchange or broker you plan to trade on
- Verify there are no missing candles or price gaps from exchange outages
- For stocks, use adjusted close prices that account for splits and dividends
- For crypto perpetual futures, include funding rate history in your data set
Pro Tip: Always source at least two years of historical data across different market conditions, including trending, ranging, and high-volatility periods. One market regime is not enough to validate any strategy.
Realistic cost modeling separates professional backtests from amateur ones. Ignoring friction costs like fees, slippage, and funding rates often turns profitable backtests into losing strategies in real trading. Include exchange-specific maker and taker fees, realistic slippage measured in ticks, and bid-ask spreads for every simulated trade.
| Tool category | Best for | Key limitation |
|---|---|---|
| Manual chart replay | Simple rule sets, low trade frequency | Time-consuming, hard to scale |
| Spreadsheet-based | Custom metric tracking, small data sets | No automation, manual data entry |
| Automated coding platforms | High-frequency, complex strategies | Requires programming knowledge |
How do you create a clear and testable trading strategy?
A strategy with vague rules produces a backtest you can manipulate without realizing it. Human bias tends to manipulate backtest rules for favorable results, so objective and fixed rules are the only defense against self-deception. Write every rule in plain language before you touch any data.
Your strategy definition must answer these questions without ambiguity:
- Entry signal: What exact condition triggers a trade? Name the indicator, the value, and the timeframe.
- Exit signal: What closes the trade? A specific indicator cross, a time-based exit, or a fixed target?
- Stop-loss: Where does the trade get cut? Express it in pips, ticks, ATR multiples, or a fixed dollar amount.
- Take-profit: What is the target? Use a fixed ratio or a defined price level.
- Position sizing: How much capital goes into each trade? Define it as a fixed percentage of account equity.
- Trade filters: What market conditions must be present? Time of day, volatility threshold, or trend direction?
Pro Tip: Simpler rules almost always backtest more honestly. Every additional parameter you add creates another opportunity to overfit the strategy to past data. Start with three rules or fewer and add complexity only when the data demands it.
Avoid the trap of adjusting rules after seeing a losing stretch in the historical data. That is overfitting in real time. Lock your rules before you run the test. If you want to test a variation, treat it as a separate strategy with its own backtest. This discipline is the foundation of a trading strategy that actually works when you move to live markets.
What are the step-by-step procedures to run a robust backtest?
A robust backtest requires multiple validation layers including clean data, realistic costs, walk-forward testing, and regime-specific analysis. Skipping any layer produces results that look good on paper but fail in live trading.
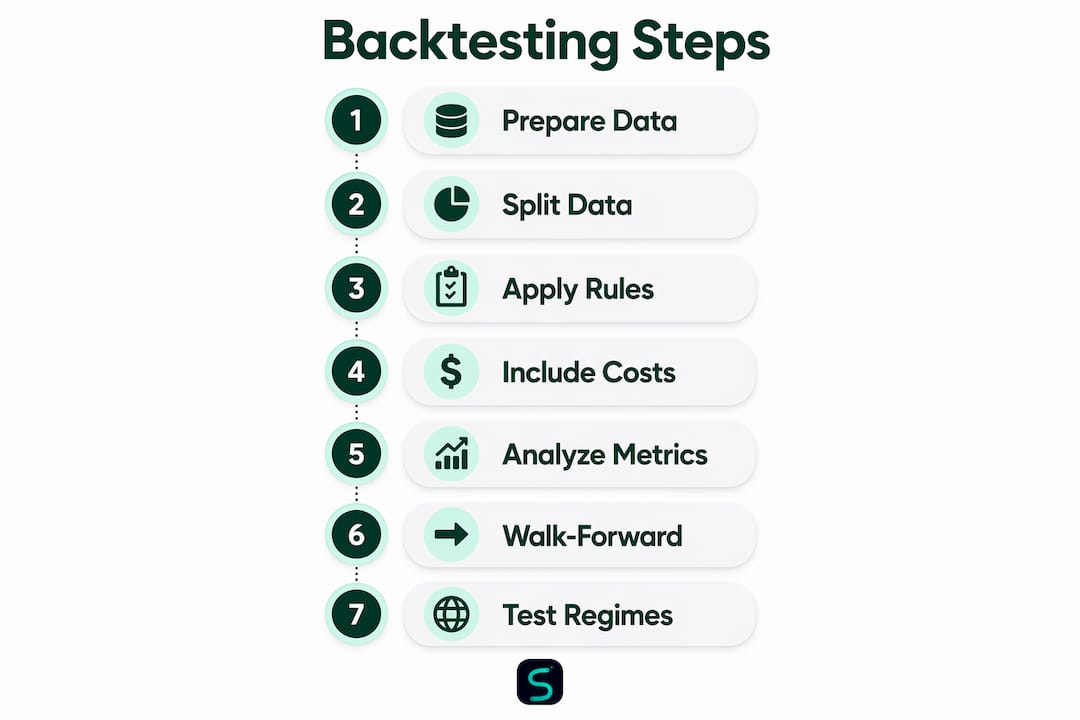
Step 1: Prepare and clean your data
Download your historical data and check it for errors. Remove duplicate rows, fill or flag missing candles, and confirm that timestamps align with your target market session. For Forex, strip out weekend data where spreads are artificial.
Step 2: Split your data into two segments
Divide your full data set into an in-sample period for testing and an out-of-sample period for validation. Lock the out-of-sample data and do not look at it until your rules are fully finalized. Professional traders use separate in-sample and out-of-sample periods to avoid lookahead bias and overfitting.
Step 3: Apply your rules consistently
Run the backtest on your in-sample data using the exact rules you defined. Apply every rule to every bar without exception. Do not skip trades because they "look wrong." Inconsistency in rule application is one of the most common beginner trading mistakes that destroys backtest validity.
Step 4: Include all transaction costs
Model every cost that will appear in live trading. This means exchange-specific maker and taker fees, realistic slippage measured in ticks, funding rates for held positions, and bid-ask spreads. A strategy that earns 1% per month before costs may lose money after them.
Step 5: Analyze your key performance metrics
| Metric | What it measures | Minimum threshold |
|---|---|---|
| Sharpe ratio | Risk-adjusted return | Above 1.0 for consideration |
| Maximum drawdown | Largest peak-to-trough loss | Must be tolerable for your account size |
| Win rate | Percentage of profitable trades | Context-dependent on reward-to-risk ratio |
| Profit factor | Gross profit divided by gross loss | Above 1.5 is a reasonable baseline |
| Trade count | Statistical sample size | At least 100 trades required |
Backtesting with fewer than 100 trades is statistically unreliable for establishing performance metrics. Sample size builds confidence in metrics like maximum drawdown and Sharpe ratio. Aim for 200 or more trades before drawing conclusions.
Step 6: Run walk-forward validation
Walk-forward testing involves optimizing on a training window and testing on a sequential out-of-sample window. This rolling validation reduces the chance of overfitting and produces more honest estimates of edge. If performance degrades sharply in the out-of-sample windows, the strategy is curve-fitted and not ready for live trading.
Step 7: Test across market regimes
Segment your data into trending, ranging, and high-volatility periods. A strategy that only works in trending markets will fail during consolidation. Knowing which regime your strategy depends on tells you when to trade it and when to stay out.
Pro Tip: Run your final validation on the out-of-sample data only once. If you use that data to tweak parameters, it becomes in-sample data by definition. Treat it like a sealed envelope you open only at the end.
What common mistakes and biases should you avoid?
Overfitting is the single biggest threat to backtest reliability. It happens when you add rules or parameters until the strategy fits historical data perfectly but has no predictive value. A reliable backtest should include out-of-sample testing and walk-forward validation to detect overfitting and confirm robustness.
The most damaging mistakes traders make:
- Lookahead bias: Using data that would not have been available at the time of the trade. This happens when indicators recalculate on historical bars or when you use closing prices to trigger entries that should use real-time prices.
- Survivorship bias: Testing only on assets that still exist today. Stocks that went bankrupt or were delisted are excluded from most data sets, which inflates apparent returns.
- Ignoring execution costs: Running a backtest with zero fees and zero slippage. This is the most common error in retail backtesting and the easiest to fix.
- Cherry-picking the time period: Testing only on the years where your strategy would have worked. Always test on the full available history.
- Insufficient sample size: Drawing conclusions from 30 or 40 trades. The metrics are meaningless at that scale.
Backtesting is a stress test for your assumptions, not a performance trophy. It reveals potential points of failure before you risk capital. A positive backtest only confirms that your rules fit historical data. It does not guarantee future profitability.
The human brain's tendency to overfit rules to historical data can be countered by rigorous out-of-sample testing and a disciplined approach to rule setting. Treat every backtest result with skepticism. The goal is to eliminate bad ideas fast, not to find a strategy that looks perfect on paper.
Key Takeaways
Backtesting is a hypothesis rejection tool: a strategy that fails historical data will almost certainly fail live, and a strategy that passes must still prove itself through walk-forward validation and forward testing before deployment.
| Point | Details |
|---|---|
| Fix rules before testing | Lock every entry, exit, stop, and sizing rule before touching historical data to prevent bias. |
| Model all costs | Include fees, slippage, spreads, and funding rates or your results will be misleading. |
| Require 100+ trades | Fewer than 100 trades produces statistically unreliable metrics like Sharpe ratio and max drawdown. |
| Use walk-forward validation | Rolling out-of-sample windows reveal overfitting that in-sample results always hide. |
| Test across market regimes | Identify whether your strategy depends on trending, ranging, or volatile conditions before going live. |
Backtesting is an elimination tool, not a crystal ball
I have reviewed hundreds of backtests from retail traders, and the pattern is always the same. The traders who struggle are the ones who treat a positive backtest as proof that a strategy works. The traders who succeed treat it as proof that a strategy has not been eliminated yet.
That shift in mindset changes everything. When you backtest to eliminate bad ideas rather than to confirm good ones, you stop manipulating your rules to get a prettier equity curve. You start asking harder questions: Does this hold up out-of-sample? Does it survive a 2020-style volatility spike? Does it still work when I add realistic slippage?
Forward testing on a demo account is the step most traders skip. They backtest, see a good Sharpe ratio, and go live. Forward testing on a demo for 60 to 90 days after a successful backtest is the bridge between historical results and real-world confidence. The market will show you things in live conditions that no historical data set captures.
The other thing I see traders ignore is regime dependency. A strategy that crushes it during a trending year will often bleed during a choppy one. Knowing your strategy's regime dependency is not a weakness. It is a trading edge, because you know when to deploy it and when to sit on your hands.
Stay disciplined. Keep your rules fixed. And use every tool available to stress-test your assumptions before real money is on the line.
— Tran
Scalping-algo's indicators for strategy testing and refinement
Backtesting gives you a foundation. The right indicators give you the signals worth testing in the first place.

Scalping-algo's premium TradingView indicators are built in Pine Script v6 and designed specifically for short-term strategies on 1-minute to 15-minute timeframes across crypto, Forex, indices, and futures. Every signal is non-repainting, which means your backtest results reflect what the indicator would have shown in real time, not what it shows after the fact. The platform's Algo Master suite combines confluence tools, volatility gating, and divergence detection into a three-indicator system built for systematic traders who want signals they can actually test and trust. If you are ready to move from theory to tested execution, Scalping-algo's tools are built for exactly that workflow.
FAQ
What is backtesting in trading?
Backtesting is the process of applying a set of fixed trading rules to historical market data to measure how a strategy would have performed. It is used to assess statistical validity before risking real capital.
How many trades do you need for a valid backtest?
A reliable backtest requires at least 100 trades to produce statistically meaningful metrics like Sharpe ratio and maximum drawdown. More trades across varied market conditions produce more trustworthy results.
What is walk-forward testing and why does it matter?
Walk-forward testing optimizes a strategy on a training window and then tests it on a sequential out-of-sample window. This rolling process detects overfitting and gives a more honest estimate of real-world performance.
How do you avoid overfitting in a backtest?
Keep your rules simple, use out-of-sample data for final validation, and avoid adjusting parameters after seeing results. Every additional rule or parameter increases the risk of curve-fitting to past data.
How do I backtest scalping strategies accurately?
Backtesting scalping methods requires tick-level or minute-level data, realistic slippage measured in ticks, and exchange-specific fee models. Use an automated trading checklist to verify every cost and execution assumption before drawing conclusions from short-timeframe results.