

A chop filter tells you whether price is moving in a straight line or churning sideways, so you can skip the trades that die in the noise. On TradingView, the most common version is the Choppiness Index (CHOP): add it from the Indicators menu, keep the length at 14 to start, and treat readings above 61.8 as chop and below 38.2 as trend. It measures how directional the market is, not which way it will go.
This guide covers what the filter actually calculates, how to set it up, which settings fit 1m to 15m scalping, and how to combine it with entries so it saves you losing trades instead of adding another line to stare at.
TL;DR
- A chop filter measures trendiness, not direction. High reading means sideways, low reading means directional.
- On TradingView, add CHOP from Indicators. Default length is 14, with reference levels at 61.8 and 38.2.
- For scalping on lower timeframes, use the filter as a gate: no entries while the market is choppy.
- Never trade the filter alone. Pair it with a signal, a direction tool and fixed risk.
- Test your settings on 50 to 100 trades before you trust them.
Table of Contents
- What a chop filter actually measures
- How to add and configure CHOP on TradingView
- Reading the levels
- How scalpers use a chop filter
- Settings and timeframes to consider
- Prove it before you trust it
- Limits you should plan around
- Put the gate and the signal in one place
- FAQ
- Sources
What a chop filter actually measures
"Chop filter" is a loose label on TradingView. Search it and you will find community scripts that paint candles, volatility meters built for one instrument, and the classic Choppiness Index. They share one job: separate tradable movement from noise.
The benchmark is the Choppiness Index. Trading Technologies defines it as a measure of whether a market is trading sideways or within a trend in either direction. The same page gives the formula: 100 times the log base 10 of the sum of one-bar true ranges over n bars divided by the highest high minus the lowest low over those n bars, all divided by the log base 10 of n.
You do not need to run that math by hand. You need to understand what it compares:
- The sum of true ranges is the total distance price traveled bar by bar.
- The high-low box is how far price actually got from start to finish of the window.
TA-Lib describes this as path efficiency. A direct move produces a low value. A lot of travel inside a narrow box produces a high value. Picture two 14-bar windows with the same total candle movement. In one, price walks from the bottom of the box to the top. In the other, it bounces around the middle. The second window scores much higher on CHOP.
Chop filter vs. Choppiness Index
The Choppiness Index is one kind of chop filter. Other community versions use different inputs:
| Type | What it reads | Typical use |
|---|---|---|
| Choppiness Index (CHOP) | True range travel vs. high-low box | Regime label in a separate pane |
| Volatility-based filter | Faster volatility gauge, often Chaikin-style | Dim or hide signals in low-energy zones |
| Moving average distance | How far price sits from an average | Quick visual trend check |
| Candle-painting filters | Recolors bars inside trends | Reducing visual noise, staying in a trend |
All of them answer one question: is this a market worth trading right now? The Choppiness Index is the best place to start because it is a built-in, widely documented, and its levels are easy to test.
How to add and configure CHOP on TradingView
Setup takes under a minute. If you have never added an indicator before, our quick setup guide for adding indicators walks through the menu.
- Open your chart and click Indicators in the top toolbar.
- Search for "Choppiness Index." Pick the built-in version, which lists as CHOP.
- It loads in its own pane under price.
- Click the gear icon to open settings.
- In Inputs, set the length. The default is 14.
- In Style, set line color and thickness. Make it thick enough to read at a glance.
- Check the horizontal bands. The defaults are 61.8 and 38.2.
The settings screen also lets you change the timeframe the indicator calculates on, the offset, and the visibility by timeframe. A walkthrough from OANDA Japan lists the same options: period 14 by default, with 61.8 and 38.2 as default bands.
Make it readable
The default pane is easy to ignore. Fix that:
- Pick a bright line color against your chart background.
- Shade the area above 61.8 in a warm color and below 38.2 in a cool one.
- Enlarge the pane so the line has room to move.
- Save the layout as a template so the filter loads on every scalping chart.
Reading the levels
The common reading is simple. According to a market education explainer, readings above 61.8 point to sideways or consolidating conditions, and readings below 38.2 point to more directional movement. Values between the two are treated as transitional.
Two cautions apply, and both matter for live trading:
- The levels are conventions. They come from Fibonacci ratios, not from a market law. Your instrument may need different lines.
- CHOP has no direction. A low reading tells you price is moving cleanly. It does not say up or down. A drop from 70 to 30 can happen in a rally or a sell-off.
TA-Lib adds a technical note: gap conditions can push the value above 100, and its implementation leaves out the optional three-bar smoothing that the indicator's creator, E.W. Dreiss, described. If your chart platform and another tool show slightly different values, that is why.
A practical three-state read
Instead of two states, use three:
| CHOP reading | State | Scalping action |
|---|---|---|
| Above 61.8 | Chop | Stand aside, or only trade range edges with small size |
| 38.2 to 61.8 | Transition | Reduce size, demand more confirmation |
| Below 38.2 | Trend | Take signals in the trend direction |
The transition zone is where most of the damage happens. Price has stopped chopping but has not committed. Treat it as a yellow light.
How scalpers use a chop filter
Scalping on 1m to 15m charts generates many setups, and many of them fail for the same reason: the market had no direction. Stops get clipped in both directions, and fees and spread eat the rest. A chop filter is a cheap way to remove a class of losing trades.
Here is a workflow that fits crypto, forex and index scalping.
Step 1: Gate first, signal second
Check the filter before you look at any entry. If CHOP is above your upper line, the answer is no trade. Do not hunt for a reason to take a setup that the filter already rejected.
Step 2: Add a direction tool
Since CHOP does not tell you direction, pair it with something that does: a higher-timeframe trend read, a moving average slope, or a momentum oscillator. Our guide to explaining momentum indicators covers how to choose one.

Step 3: Use the filter on a higher timeframe too

A 5-minute chart can look trending while the 15-minute chart is stuck in a range. Run CHOP on both. If the higher timeframe reads chop, expect your 5-minute breakouts to run into a wall. This kind of multi-timeframe check is the same logic behind confluence-based indicator use for precision scalping.
Step 4: Match the tactic to the state
- Trend state: trade pullbacks and continuations in the trend direction.
- Chop state: either sit out or switch to range tactics. Our piece on trading ranging markets covers how sideways price action behaves.
- Transition state: wait for a break of structure, then re-check the filter.
Step 5: Log it
Add the CHOP value at entry to every trade in your journal. After a few weeks you can sort your results by state and see how your own setups perform when CHOP is high, middle and low. That beats any default.
Settings and timeframes to consider
The default of 14 is a fair starting point on most charts, but it is a start, not a rule.
| Style | Timeframe | Length to test | Why |
|---|---|---|---|
| Fast scalping | 1m | 10 to 14 | Reacts quickly, but flips more often |
| Standard scalping | 5m | 14 | Balanced reading |
| Slower scalping | 15m | 14 to 21 | Fewer flips, clearer regime |
| Regime check | 1h | 14 | Context for the lower chart |
These are test ranges, not recommendations backed by a study. Shorter lengths respond faster and flip more. Longer lengths smooth the line and lag. Choose by backtesting on your own market.
Tuning the levels
- If the line rarely reaches 61.8 on your instrument, lower the upper band to 55 or 58 and see whether it separates choppy sessions better.
- If it sits above 38.2 even in clean trends, move the lower band up.
- Change one thing at a time. Change both the length and the bands at once and you will not know which helped.
Watch the session
Chop is not random across the day. Many markets get quiet outside their main sessions, and the filter will show it. Look at your own charts for when the line sits high, and plan your trading hours around the clean stretches rather than forcing trades all day. Our overview of volatility indicators explains related tools for reading market energy.
Prove it before you trust it
A filter that looks good on a handful of charts proves nothing. Test the effect, not the picture.
- Pick one entry method and keep it fixed.
- Run it for 50 to 100 trades without the filter, recording each trade in R (profit or loss as a multiple of your initial risk).
- Run the same method with the filter, skipping trades when CHOP is above your band.
- Compare average R per trade, drawdown and number of trades.
If the filtered version makes fewer trades but a better average R, the filter is earning its place. If it simply cuts trades and results, change the settings or drop it. The method of judging by R-multiples and expectancy over 50 to 100 trades keeps you honest about win rate, which can look great while the average loss quietly outgrows the average win.
Limits you should plan around
No single indicator carries a strategy. Plan for these:
- Lag. CHOP looks back over a window. By the time it reads "trend," part of the move is done.
- No direction. It confirms a clean move, not the side to take.
- Gaps. As noted above, gaps can distort the reading.
- Whipsaw around the bands. The line can hover near 61.8 or 38.2 and cross repeatedly. Use a buffer, such as requiring a close beyond the band for two bars.
- Settings drift. What works on one asset can fail on another.
The same discipline applies to any tool. Our guide on assessing indicator reliability for scalping gives a checklist you can reuse for CHOP or anything else on your chart. Trading carries a real risk of loss, and an indicator does not change that. Size every position so that a string of losses does not threaten your account.
Our take: filter the regime, then act
We build our tools around one idea: most scalping losses come from taking good-looking signals in bad conditions. A chop filter is the simplest way to see that, and it is why regime awareness sits at the center of how we design indicators.
Our approach is to gate first. Volatility gating decides whether a market is worth trading, signals confirm on candle close so they do not repaint, and multi-timeframe confluence checks that the bigger picture agrees. Every script is open source, so you can read the logic behind each filter and judge it yourself.
A standalone CHOP pane is a good teacher. Use it to learn what chop looks like. Then move to a system where the gate, the signal and the alert live together, so you are not juggling five panes at 1-minute speed.
Tran
Put the gate and the signal in one place
If you would rather not stitch together a chop pane, a signal script and an alert rule by hand, our TradingView suite does it in one setup. It includes non-repainting buy and sell signals optimized for 1m to 15m charts, volatility gating, multi-timeframe confluence, projected take-profit and stop-loss levels, and Discord webhook alerts. You can see how the regime side works in Edge Finder and the signal side in Smart Scalping Signals.
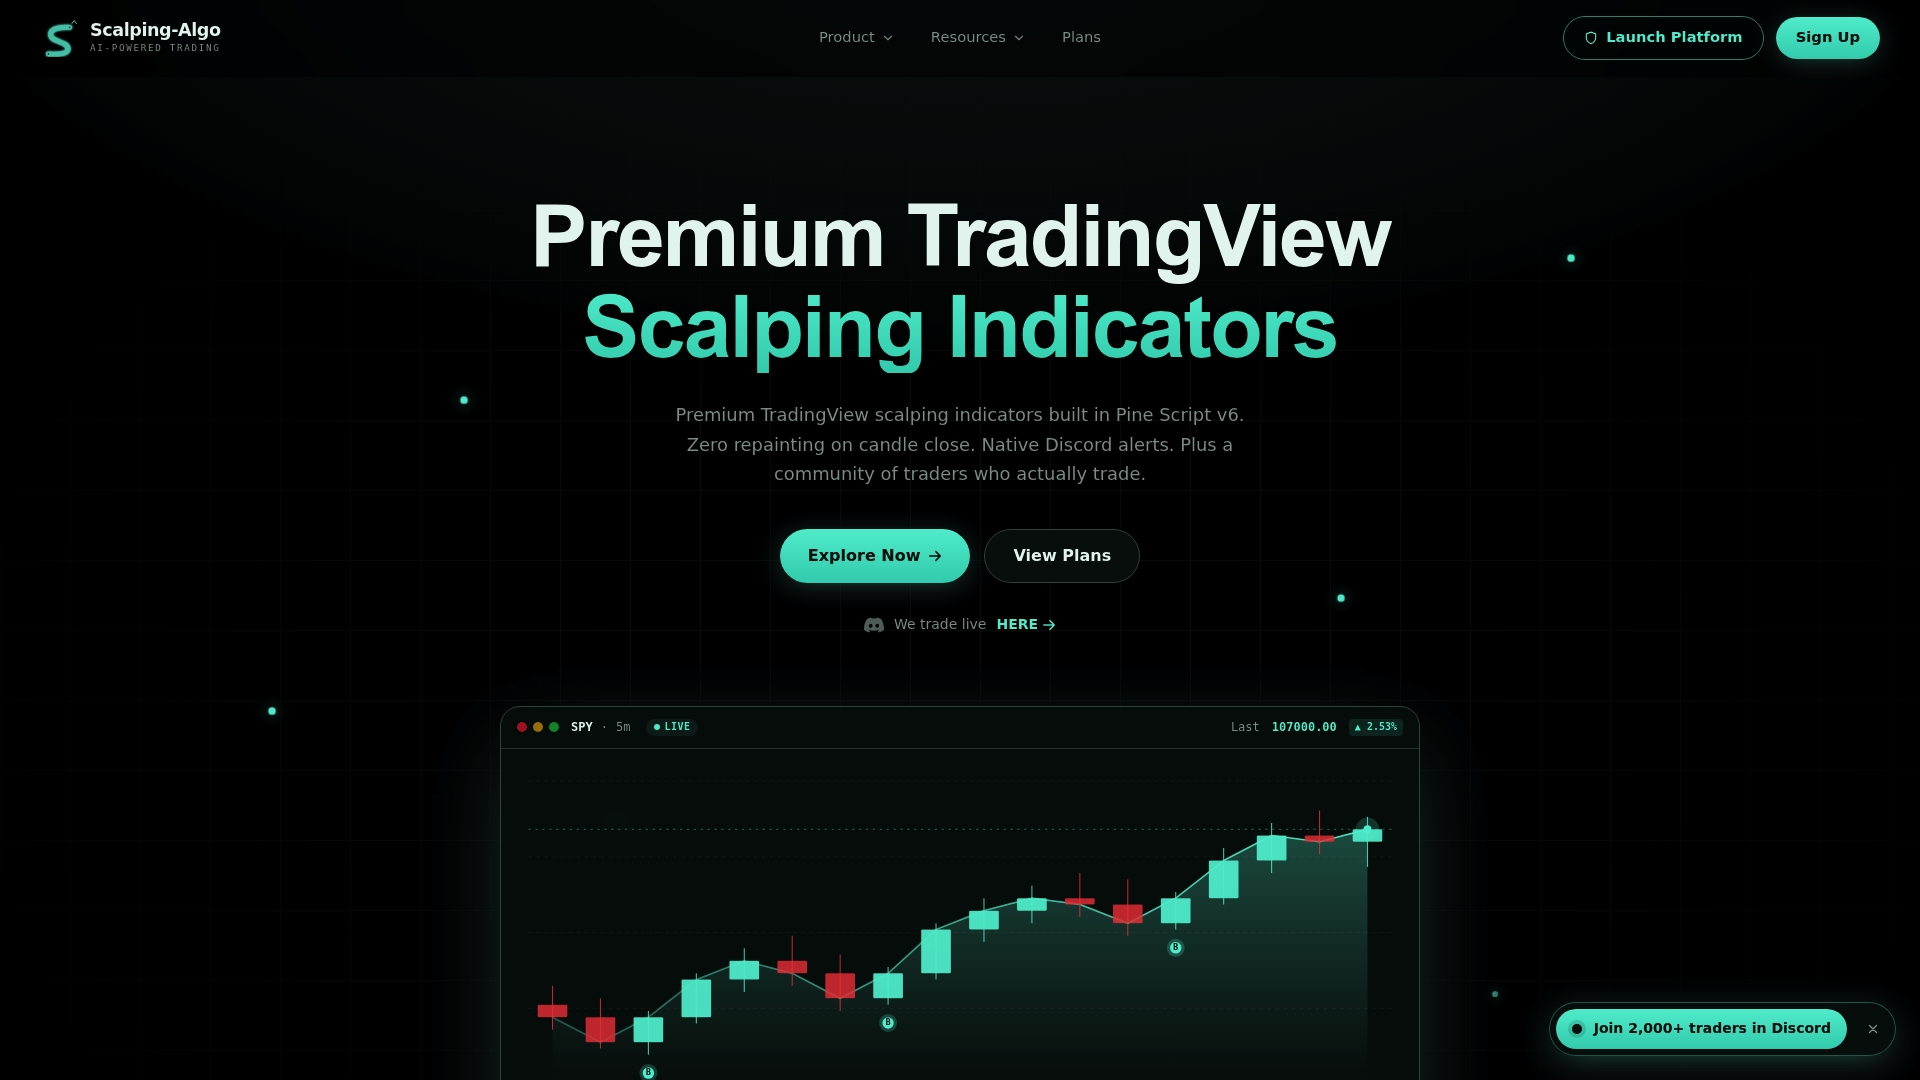
Plans are $79 per month, $799 per year, or $1,999 one-off for lifetime access. Pick a plan on the Scalping-Algo home page, and see our Trading Tricks & Tips for shortcuts you can apply right away.
FAQ
What is the best chop filter on TradingView?
There is no single best one. The Choppiness Index is the standard starting point because it is built in and well documented. Faster volatility-based filters and candle-painting scripts suit traders who want a quicker or cleaner visual. Test two or three against your own entry method and keep the one that improves your average R.
What CHOP setting is best for scalping?
Start with length 14 and the 61.8 and 38.2 bands, then test lengths from 10 to 21 on your timeframe. Shorter lengths react faster but flip more often. Judge each setting by results over 50 to 100 trades, not by how the chart looks.
Can a chop filter tell me whether to buy or sell?
No. The Choppiness Index measures whether the market is trending, not in which direction. Combine it with a trend or momentum tool to pick the side.
Does a chop filter work on crypto and forex?
Yes, the calculation uses only price ranges, so it can run on any chart. Behavior differs by market and session, so tune the bands separately for each instrument. Crypto trades around the clock, so check which hours read choppy rather than assuming.
Sources
- Choppiness Index, Trading Technologies Help Library
- Choppiness Index (CHOP), TA-Lib
- Choppiness Index: Spot Trends vs Sideways Markets
- TradingViewでチョピネスインデックスを設定する方法, OANDA Japan