

A ranging market is a sideways price environment where price oscillates between a defined horizontal support and resistance level, and the primary trading edge is mean reversion: buy near support, sell near resistance, and size for smaller, more frequent targets. The industry term is "range-bound market," though traders also call it consolidation, a channel, or a sideways market. Mastering this regime matters because markets spend most of their time in ranges, not trends.
Three rules to apply right now:
- Diagnostic filter: Check ADX first. ADX below 20 signals a ranging regime; ADX above 25 signals a trend. Do not fade edges in a trending market.
- Primary tactic: Fade the edges with confirmation. Wait for at least two confirmed touches of both support and resistance, then enter on oscillator signal plus a price-action rejection candle.
- Headline risk control: Size smaller than you would in a trend. Smaller targets mean tighter reward-to-risk per trade; frequency and discipline compensate, not leverage.
Quick-scan checklist before you trade any range:
- ADX below 20 on your primary timeframe
- At least two clean touches of both the support and resistance boundary
- Higher timeframe agrees (no active trend on the chart one level up)
- Oscillator (RSI or Stochastic) confirming oversold at support or overbought at resistance
- Range wide enough to cover spread, slippage, and still leave a 1.5:1 reward-to-risk minimum
- Stop placed beyond the boundary plus one ATR buffer
Key Takeaways
Range-bound markets, where price oscillates between horizontal support and resistance without directional progress, reward traders who combine structural regime confirmation with oscillator timing and strict ATR-based position sizing.
| Point | Details |
|---|---|
| Regime filter first | ADX below 20 plus horizontal swing structure confirms a range; never fade edges without this check. |
| Two-touch minimum | Require at least two confirmed touches of both support and resistance before classifying a market as tradeable range. |
| Three-signal entry | Enter only when boundary touch, oscillator extreme (RSI below 30 or above 70), and a price-action rejection candle align simultaneously. |
| ATR-based stops | Set stops beyond the boundary plus 1.0–1.5× ATR; risk no more than 1–2% of account equity per trade. |
| Scalping-algo workflow | Use Scalping-algo's non-repainting signals, volatility gating, and Discord webhook alerts to run the detect-confirm-execute workflow without manual indicator stacking. |
Table of Contents
- What exactly is a ranging market?
- How do ranging markets differ from trending and breakout regimes?
- How do you detect a ranging market reliably?
- Which indicators work best for range trading?
- Step-by-step range trading entries, exits, and order management
- Risk management and position sizing for ranging markets
- What are the most common pitfalls in range trading?
- Annotated trade examples across forex, stocks, and crypto
- A practical workflow for trading ranges from detection to execution
- Range trading is harder than it looks, and that is the edge
- Scalping-algo gives you the tools to execute range tactics precisely
- Sources
What exactly is a ranging market?
A ranging market, also called a range-bound or sideways market, is a price environment where no progressive sequence of higher highs and higher lows (uptrend) or lower highs and lower lows (downtrend) is forming. Instead, price repeatedly reverses between a horizontal support floor and a resistance ceiling. The structure is defined by swing highs clustering near the same price level and swing lows clustering near another, with no net directional progress over the observed period.
Traders use several interchangeable labels: consolidation (price pausing after a move), channel (when the range has a slight slope), and sideways market or choppy market (informal). For practical purposes, treat these as the same regime unless the slope is steep enough to qualify as a trend.
Timeframe examples:
- Intraday (5-minute to 1-hour): EUR/USD frequently ranges between two price levels for 2–4 hours before a news catalyst breaks it out. A 20-pip range on the 15-minute chart is a common intraday structure.
- Swing (4-hour to daily): S&P 500 futures often consolidate for 1–3 weeks between key technical levels after a sharp directional move, giving swing traders 3–5 fade opportunities per range.
- Weekly: Commodities like crude oil can range for months between major supply/demand zones, offering position traders repeated entries at well-defined boundaries.
The minimum verification rule: require multiple confirmed touches of both the support boundary and the resistance boundary before classifying a market as ranging. A single bounce off a level is not a range; it could be a brief pause inside a trend. Two touches on each side, with clear reversals, establish the structure as range-bound.
How do ranging markets differ from trending and breakout regimes?
Understanding trend vs range markets is the most important regime decision you make before placing a trade. Trend-following and range strategies require fundamentally different money-management techniques, and applying the wrong one to the wrong regime is one of the most common causes of strategy failure.
| Feature | Ranging market | Trending market | Breakout setup |
|---|---|---|---|
| Price structure | Horizontal HH/HL clusters; no net progress | Progressive HH/HL (up) or LH/LL (down) | Range compression followed by a decisive close outside boundary |
| ADX reading | Below 20 | Above 25 and rising | Rising from below 20 toward 25+ |
| Indicator behavior | RSI/Stochastic oscillate reliably between extremes | Oscillators stay overbought/oversold for extended periods | Volume expands sharply; ADX accelerates |
| Stop placement | Just outside the boundary plus ATR buffer | Trailing stop below recent swing low/high | Beyond the breakout candle's wick plus ATR |
| Target approach | Fade to opposite boundary; partial profit at midpoint | Trail to next swing structure or measured move | Measured move from range width projected from breakout point |
| Risk profile | Frequent small wins; occasional sharp loss on breakout | Larger wins; drawdown during consolidation phases | Binary: full target or stopped out on false break |
Decision rules for switching styles:
- Stay in range mode when ADX is below 20, swing structure shows no progressive highs or lows, and the higher timeframe is also non-directional.
- Stop fading and watch for breakout when price makes two successive closes outside a boundary, volume expands above the 20-period average, and ADX begins rising.
- Commit to trend mode when ADX clears 25, a retest of the broken boundary holds, and the higher timeframe confirms the new direction.
IF/THEN decision checklist:
- IF ADX < 20 AND structure is horizontal → range-fade mode
- IF ADX 20–25 AND structure is ambiguous → reduce size, wait for clarity
- IF ADX > 25 AND progressive structure → trend-follow mode, no fading
- IF price closes outside boundary AND volume expands → prepare for breakout entry, not a fade
- IF breakout candle retests boundary AND holds → confirm breakout, enter directional
How do you detect a ranging market reliably?
Lead with structure, confirm with ADX, and use the higher timeframe as the tie-breaker. That sequence is the most reliable detection process available to retail traders, and it takes under a minute once you have practiced it.
FX Foundations recommends a repeatable regime-diagnosis process: zoom out to the next higher timeframe, mark the four to six most recent swing highs and lows, and check whether they form a horizontal cluster or a progressive sequence. Only after that structural read should you apply ADX as objective confirmation.
Indicator thresholds to check:
- ADX (14-period default): Below 20 = ranging. The DI+ and DI- lines will be close together and crossing frequently, which is another visual confirmation.
- ATR (14-period): Declining or flat ATR relative to recent history suggests contracting volatility, consistent with consolidation. A sudden ATR spike is an early warning that the range may be ending.
- Bollinger Bands (20-period, 2 standard deviations): A squeeze (bands narrowing) signals low volatility and potential range continuation. Price bouncing between the upper and lower bands without breaking them confirms the range.
- Moving averages (20 EMA and 50 EMA): When both are flat and price is crossing back and forth through them repeatedly, the market is ranging. Diverging EMAs signal a trend.
Multi-timeframe rule: If you trade the 1-hour chart, check the 4-hour and daily first. The range on your trading timeframe is only valid if the higher timeframe is not in a strong trend. A 1-hour range inside a daily uptrend is a pullback, not a true range, and fading it against the daily trend carries extra risk.
Detection checklist:
- Mark 4–6 recent swing highs and lows on your chart
- Confirm no progressive sequence (no HH/HL or LH/LL pattern)
- Check ADX 14: below 20 = range confirmed
- Check higher timeframe: no strong directional trend
- Verify at least two touches on each boundary
- Check ATR and Bollinger Bands for volatility contraction
Pro Tip: Watch for a trend that is losing momentum before ADX confirms the range. Shrinking candle bodies, repeated wicks into the prior swing high or low without follow-through, and a flattening 20 EMA are structural signs that a trend is decaying. You can start treating the market as a potential range before ADX drops below 20, which gives you earlier entry opportunities at the boundaries.
Which indicators work best for range trading?
The right toolkit for ranging markets is short: a regime filter, a timing oscillator, a volatility measure, and an anchor level. More indicators do not improve accuracy; they create conflicting signals and slow your decision-making.
Primary indicators and settings
ADX (14-period): The regime filter. Use it to confirm you are in a range before applying any other tool. Below 20 = green light for range tactics. Check the DayTradingToolkit's ADX guidance for practical threshold application.
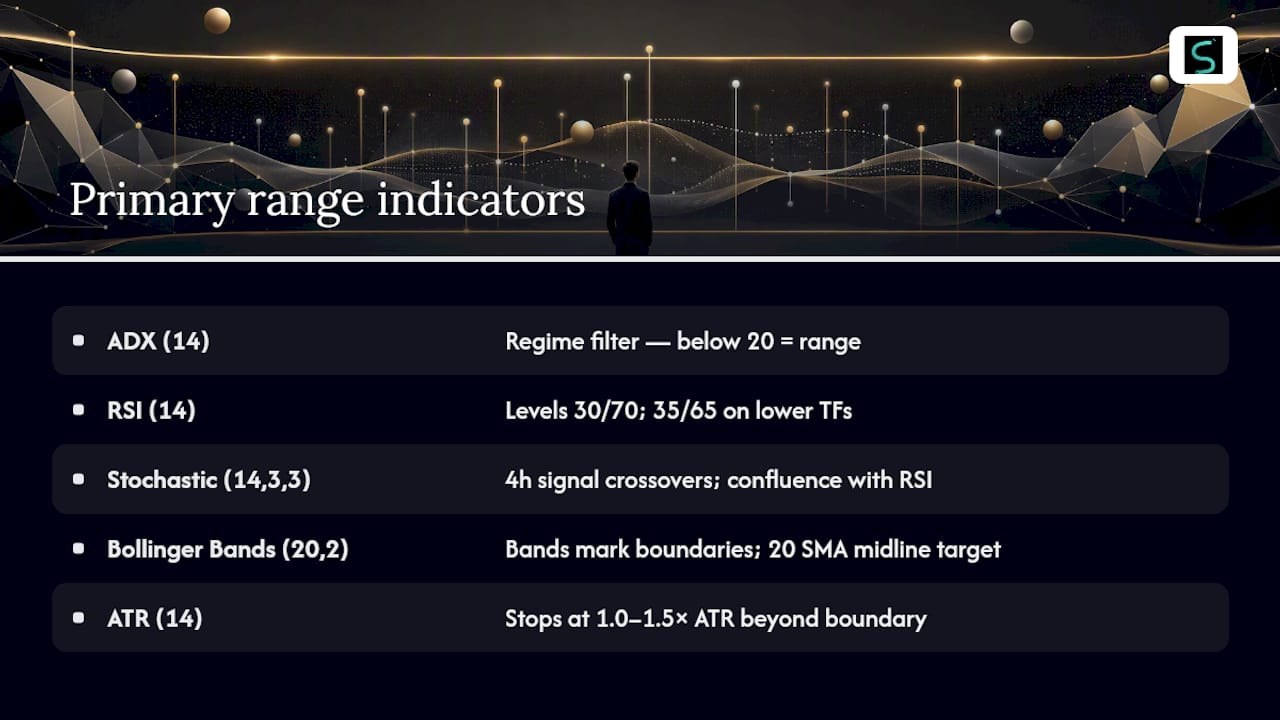
RSI (14-period, levels 30/70): The primary timing oscillator in ranges. RSI reaching 30 near support signals a potential long; RSI reaching 70 near resistance signals a potential short. In a confirmed range, these readings are far more reliable than in a trending market, where RSI can stay overbought for extended periods. For institutional-grade indicator setups, tightening RSI levels to 35/65 on lower timeframes reduces false signals.
Stochastic (14,3,3): A secondary oscillator that complements RSI. When both RSI and Stochastic are oversold simultaneously at support, the confluence is stronger than either signal alone. On the 4-hour chart, use Stochastic (14,3,3) with signal-line crossovers as the trigger.
Bollinger Bands (20-period, 2 standard deviations): Use the bands as a visual range boundary overlay. Price tagging the upper band near resistance or the lower band near support adds a third layer of confirmation. The midline (20 SMA) acts as a natural partial-profit target.
ATR (14-period): The volatility measure for stop sizing. In ranges, use 1.0–1.5× ATR beyond the boundary as your stop distance. On the 1-hour chart, ATR might read 15 pips on EUR/USD; your stop goes 15–22 pips beyond the boundary. For volatility-based stop placement, ATR is the most objective tool available.
VWAP (daily reset): On intraday charts, VWAP acts as a mean-reversion anchor. Price returning to VWAP from the range boundary is a common partial-profit target for day traders.
Combining indicators: what confirmation looks like
The highest-probability range entry combines three signals arriving together: price-action rejection at the boundary (a pin bar, engulfing candle, or inside bar), RSI at an extreme (below 30 or above 70), and decreasing volume into the touch. All three together is the signal. Any two without the third is a watch, not a trade.
Timeframe-specific settings:
- 1-hour chart: RSI 14 (30/70), Stochastic 14,3,3, ATR 14, Bollinger Bands 20/2
- 4-hour chart: RSI 14 (35/65 for tighter confirmation), ADX 14, ATR 14, VWAP optional
- Daily chart: ADX 14, RSI 14 (30/70), Bollinger Bands 20/2, 50 EMA as midrange reference
Pro Tip: Avoid adding more than four indicators to a range-trading chart. In low-liquidity symbols (small-cap stocks, exotic FX pairs, low-volume crypto), oscillators generate excessive noise and false signals. Stick to structure plus one oscillator plus ATR in those conditions, and widen your boundary buffer to 2× ATR.
Step-by-step range trading entries, exits, and order management
The highest-probability approach is fading the edges with confirmation. Here is the exact execution sequence.
-
Confirm the regime. ADX below 20, horizontal swing structure, higher timeframe non-directional. If any of these fails, do not enter.
-
Identify the boundary. Mark the support zone (cluster of swing lows) and the resistance zone (cluster of swing highs). Use a zone, not a single line, to account for wicks and minor variations.
-
Wait for price to reach the boundary. Do not anticipate. Let price come to the zone. Entering early, in the middle of the range, gives you a poor reward-to-risk ratio.
-
Check oscillator confirmation. RSI below 30 (for a long at support) or above 70 (for a short at resistance). Stochastic crossing in the same direction adds weight.
-
Wait for a price-action candle. A pin bar, bullish/bearish engulfing, or inside bar closing back inside the range is the trigger. This candle is your entry signal.
-
Check volume. Volume should be declining into the boundary touch (showing exhaustion) or showing a spike on the rejection candle (showing conviction). Avoid entries where volume is expanding into the boundary without a rejection candle.
-
Set your stop. Place the stop beyond the boundary zone plus 1.0–1.5× ATR. For a long at support: stop = support low minus 1.0× ATR. This accounts for wicks and minor false breaks without giving up too much capital.
-
Set your targets. Primary target: 50–60% of the range width from entry. Full target: the opposite boundary minus a small buffer (do not expect price to hit the exact opposite level every time). Take partial profit at the midpoint (Bollinger midline or VWAP).
-
Choose your order type. Limit orders at the boundary are preferred for range trades; they give you price certainty and avoid chasing. Use a market order only if the rejection candle closes and you are confident in the momentum. OCO (one-cancels-other) orders work well: set the limit entry, stop, and target simultaneously.
-
Manage the trade. Once price reaches the 50% target, move the stop to breakeven. Let the remaining position run to the full target. Do not hold through a boundary break.
Example long trade (EUR/USD, 1-hour range): Range: 1.0820 support, 1.0880 resistance (60-pip range). ATR = 12 pips. Price touches 1.0820, RSI reads 28, pin bar closes at 1.0826. Entry: 1.0826 limit. Stop: 1.0820 minus 12 pips = 1.0808 (18-pip stop). Target 2: 1.0872 (46 pips, near resistance minus buffer). Reward-to-risk on T1: 1.67:1.
Example short trade (S&P 500 futures, 4-hour range): Range: 5,200 support, 5,280 resistance (80-point range). ATR = 18 points. Price reaches 5,278, RSI reads 72, bearish engulfing candle closes at 5,271. Entry: 5,271 limit. Stop: 5,280 plus 18 = 5,298 (27-point stop). Target 1: 5,241 (30 points, partial). Target 2: 5,208 (63 points, near support). Reward-to-risk on T1: 1.1:1 (acceptable given high win rate at confirmed boundaries).

Risk management and position sizing for ranging markets
Smaller targets are the defining feature of range trading, and your position sizing must reflect that reality. A 60-pip range in EUR/USD does not give you the same profit potential as a 200-pip trend move, so managing stop budgets carefully is non-negotiable.
Because targets are smaller and you may take multiple trades per range, total daily exposure can accumulate quickly.
ATR-based position sizing formula:
Position size = Dollar risk ÷ (ATR × ATR multiplier × point value)
Worked example (forex): Account: $10,000. EUR/USD ATR (1-hour) = 12 pips. Stop = 1.5× ATR = 18 pips. Point value per standard lot = $10/pip.
Position size = $100 ÷ (18 pips × $10) = $100 ÷ $180 = 0.55 lots (round to 0.5 lots)
For detailed forex risk management and lot-sizing examples across instruments, the FX market's flexible lot sizing is one reason it suits range traders particularly well.
Stop budgeting rules:
- Stop = boundary zone edge plus 1.0–1.5× ATR (never tighter; wicks will stop you out)
- Maximum stop distance: 2× ATR. If the range is too narrow to accommodate a 2× ATR stop and still leave a 1.5:1 reward-to-risk, skip the trade.
- Daily stop-out limit: if you lose 3% of account in a single session, stop trading for the day.
Multiple entries and correlation risk:
If you scale into a position (adding at the boundary after an initial entry), treat the combined position as one trade for risk purposes. If you are trading multiple instruments in the same sector (e.g., two tech stocks or two commodity pairs), their ranges may break simultaneously, doubling your loss. Check instrument correlation before sizing both positions at full risk. For futures-specific sizing and rollover considerations, range tactics in futures markets require additional attention to contract specifications and liquidity depth.
What are the most common pitfalls in range trading?
Most range-trading losses come from three errors: fighting a real breakout, trusting oscillators without structural confirmation, and overleveraging because the setup looks "obvious."
Common pitfalls:
- Fading a real breakout: The most expensive mistake. Price closes outside the boundary, you fade it expecting a return, and it keeps going. Always require a confirmed close outside the boundary before considering a breakout real.
- Oscillator-only entries: RSI hitting 30 inside a trending market is not a range signal. Oscillators must be combined with structural confirmation (horizontal swing points, ADX below 20) or they generate false mean-reversion signals constantly.
- Overleveraging: Because range targets are predictable, traders often size up. One breakout trade against an overleveraged position can wipe out weeks of gains.
- Ignoring the higher timeframe: A range on the 1-hour chart inside a daily downtrend is a pullback. Fading the top of that range against the daily trend is low-probability.
- Trading ranges that are too narrow: If the range width does not cover spread plus slippage plus a meaningful profit, the trade has negative expected value before you even enter.
Red flags that a range is ending:
- Price compresses into a tight zone (Bollinger Bands squeeze), then a candle closes outside with expanding volume
- Oscillator readings fail to reach their extremes on successive touches (RSI only reaches 40 instead of 30 at support, signaling weakening buying pressure)
- Successive new highs or lows form, breaking the horizontal structure
- ADX begins rising from below 20 toward 25
"Knock on the door" behavior vs. real breakout:
Breakouts from ranges are frequently false. A single close outside the boundary without volume expansion is a "knock on the door": price is testing the level, not breaking it. A real breakout shows a close outside the boundary, volume above the 20-period average, ADX rising, and a successful retest of the broken boundary from the other side.
Exit or size-reduction checklist if breakout risk appears:
- Price closes outside the boundary on your timeframe
- Volume expands above the 20-period average on the breakout candle
- ADX begins rising above 20
- Oscillator fails to reverse at the boundary (no rejection candle)
- Higher timeframe shows a directional move in the breakout direction
If two or more of these appear, exit the range trade immediately. Do not wait for your stop to be hit.
Annotated trade examples across forex, stocks, and crypto
Forex: EUR/USD 1-hour range
Setup: EUR/USD establishes a range between 1.0820 (support) and 1.0880 (resistance) over 18 hours. ADX reads 16. RSI oscillates between 28 and 72 across four boundary touches, two on each side.
Entry (long at support): Price touches 1.0822, RSI reads 29, a bullish pin bar closes at 1.0828. Limit order placed at 1.0828. ATR = 11 pips. Stop: 1.0820 minus 11 = 1.0809 (19-pip stop). Target 1: 1.0850 (22 pips). Target 2: 1.0872 (44 pips).
Execution notes: Limit order filled without slippage during the London session. Stop moved to breakeven. Target 2 reached 6 hours later. Total trade: 33 pips average across the two exits. The range trading entry requirements of two prior boundary tests and oscillator confirmation were both satisfied before entry.
Equity/index: S&P 500 futures (ES), 4-hour range
Setup: ES consolidates between 5,200 and 5,280 for eight trading days. ADX reads 14. The daily chart shows no progressive structure. Range width: 80 points, well above the minimum needed to cover slippage and commissions.
Entry (short at resistance): Price reaches 5,277, RSI reads 71, bearish engulfing candle closes at 5,268. ATR = 20 points. Stop: 5,280 plus 20 = 5,300 (32-point stop). Target 1: 5,248 (20 points). Target 2: 5,210 (58 points).
Execution notes: Liquidity in ES futures is deep; limit orders fill cleanly at resistance. Partial profit taken at Target 1. The wider ATR buffer (20 points) is appropriate for a futures contract with higher nominal volatility than FX. For short-term execution tactics in index futures, the same structural rules apply but position sizing must account for the larger point value per contract.
Crypto: Bitcoin (BTC/USD), 4-hour range
Setup: BTC consolidates between $62,000 and $66,000 for five days. ADX reads 18. ATR = $1,200.
Entry (long at support): Price touches $62,200, RSI reads 32, Stochastic crosses bullish. Limit order at $62,300. Stop: $62,000 minus $1,200 = $60,800 ($1,500 stop). Target 1: $64,000 ($1,700). Target 2: $65,600 ($3,300).
Execution notes: Crypto ranges carry higher volatility than FX or equity ranges, so the ATR buffer is wider (1.5× ATR minimum). Slippage on crypto limit orders can be significant during news events; use limit orders only and avoid market orders at boundaries. For crypto-specific range tactics, including volatility spikes and exchange-specific liquidity differences, extra caution on stop placement is standard practice. Instrument liquidity depth matters here: checking order book depth before sizing a crypto range trade is worth the extra 30 seconds.
Cross-asset adaptation notes: The same structural rules (two boundary tests, ADX below 20, oscillator confirmation, ATR-based stop) apply across all three asset classes. What changes is the ATR multiplier for stops (1.0× for liquid FX, 1.5× for futures, 1.5–2.0× for crypto) and the order type preference (limit orders universally preferred, market orders only in deep-liquidity instruments during active sessions).
A practical workflow for trading ranges from detection to execution
The one-sentence workflow: Detect the regime, confirm with indicators, backtest the setup, set alerts, execute with discipline, and review after the close.
This sequence keeps you from skipping steps under pressure. Each stage has a concrete output.
Detect: Run the structural check (4–6 swing points, horizontal or progressive) plus ADX below 20. Use the higher timeframe as the final filter. This takes 60 seconds per chart.
Confirm: Apply RSI, Stochastic, and Bollinger Bands. Wait for the three-signal confluence (boundary touch plus oscillator extreme plus price-action candle). Do not enter on two signals alone.
Backtest: Before trading any range setup live, test the entry rules on at least 30 historical range periods on the same instrument and timeframe. Key variables to test: entry filter (oscillator threshold), stop distance (1.0× vs 1.5× ATR), slippage assumption (add 0.5–1 pip for FX, 1–2 points for futures), and sample size (30 trades minimum for statistical relevance). For a rules-based strategy testing framework, backtesting with realistic slippage assumptions is what separates a working setup from a curve-fitted one.
Alert: Set price alerts at both boundaries so you do not need to watch the screen continuously. Alerts at the boundary minus 5 pips (for FX) give you time to check the oscillator and prepare the order before price arrives.
Execute: Follow the step-by-step entry checklist. No exceptions for "gut feel" entries.
Review: After each session, log the trade: regime confirmed (yes/no), signals present (how many), entry price, stop, target, outcome. Patterns in your review log will show you where your execution breaks down.
Scalping-algo implementation checklist:
- Load the Scalping-algo indicator suite on TradingView; set ADX and RSI parameters to match your timeframe (14-period for both on 1H and 4H)
- Enable volatility gating so signals are suppressed when ATR spikes above threshold (protects against false entries near breakouts)
- Configure webhook alerts to Discord for boundary touches on your watchlist symbols
- Use the Command Center backtesting dashboard to validate entry filters on historical data before going live
- Note: Scalping-algo signals are non-repainting, meaning the signal you see on a closed candle will not change retroactively. This is critical for backtesting accuracy.
- Join the Discord mentorship sessions to review range setups with the community before trading them live
Pro Tip: Build a watchlist of 5–8 instruments that are currently ranging (ADX below 20, confirmed structure). Set boundary alerts on all of them. When an alert fires, run the three-signal check. This approach lets you monitor multiple opportunities without screen fatigue, and you only engage when the setup is fully formed.
Quick pre-trade checklist: run this in 60 seconds
Regime checks:
- ADX below 20 on your trading timeframe
- No progressive swing structure (no HH/HL or LH/LL)
- Higher timeframe is non-directional or agrees with the range
Signal checks:
- Price is at or within 5 pips/points of the boundary zone
- Oscillator (RSI or Stochastic) is at an extreme (below 30 or above 70)
- Price-action rejection candle has closed (pin bar, engulfing, or inside bar)
- Volume is declining into the touch or spiking on the rejection candle
Execution checks:
- Order type selected (limit preferred)
- Stop placed beyond boundary plus 1.0–1.5× ATR
- Target 1 set at 50% of range width; Target 2 at opposite boundary minus buffer
- Alert created for trade management (boundary breach notification)
Risk checks:
- Position size calculated using ATR-based formula (dollar risk ÷ stop distance × point value)
- Dollar risk is within 1–2% of account equity
- Total open exposure (all positions combined) is below 5% of account equity
- Daily loss limit not already reached (if at 3% daily loss, no new trades)
If any check fails, do not enter. Wait for the next setup.
Range trading is harder than it looks, and that is the edge
Most traders underestimate how psychologically demanding range trading is. Trend trading gives you a clear directional bias; you hold and let the market do the work. Range trading requires you to act against the most recent price movement repeatedly, fade a move that feels like it might keep going, and take profits before the full range width is reached.

The discipline gap is real. Traders who succeed in ranges are not the ones with the best indicators. They are the ones who follow the checklist, take the partial profit at the midpoint, and exit immediately when a boundary breaks rather than hoping for a return. The most common failure mode is not a bad entry. It is a good entry held too long because the trader wanted the full range width when the market had already signaled a breakout.
There is also a regime-recognition problem that most guides skip. A range on the 1-hour chart inside a daily trend is not a neutral environment. It is a pullback, and fading the top of that pullback against the daily trend is a low-probability trade dressed up as a range fade. The higher-timeframe check is not optional; it is the filter that separates genuine range trades from trend-continuation setups in disguise.
The practical lesson: treat the pre-trade checklist as a non-negotiable gate, not a suggestion. Every item exists because skipping it has a documented cost. ADX above 20? Skip the trade. Only one boundary touch confirmed? Skip the trade. The market will give you another setup. The capital you preserve by skipping marginal setups is the capital that funds your best ones.
Scalping-algo gives you the tools to execute range tactics precisely
Range trading rewards preparation and precision, and Scalping-algo's TradingView indicator suite is built for exactly that kind of structured execution. The platform's non-repainting buy and sell signals fire at boundary conditions with oscillator and volatility gating already built in, so you are not manually checking five indicators before every entry. The Command Center dashboard integrates backtesting, alerts, and signal history in one place, letting you validate your range setup parameters on historical data before committing real capital.

Webhook alerts push boundary notifications directly to Discord, which means you can run a watchlist of ranging instruments without sitting in front of the screen all day. The Discord mentorship community runs live sessions where range setups are reviewed in real time, giving you a second set of eyes on your regime reads and entry timing. Whether you are trading forex, crypto, or index futures, the Scalping-algo indicator suite maps directly to the detection-confirm-execute workflow covered in this guide. Start with the free trial, load the indicators on your current watchlist, and run the pre-trade checklist on your next range setup before placing a single live order.
Sources
- Trend vs range discussion and FX suitability — Investopedia
- Trend vs. Range Markets: How to Read Market Conditions | DayTradingToolkit
- Range Trading: Profit in Sideways Markets | FinWiz
- Trending vs Ranging Markets | Free Intermediate Forex Lesson | FX Foundations
This article is general information, not a substitute for advice from a qualified financial advisor. Consult a qualified financial professional about your own circumstances before acting on anything here.