

Short-term trading is defined as holding financial assets from seconds to a few weeks, with the goal of profiting from rapid price movements rather than long-term value growth. Understanding short term strategies means recognizing that momentum, not fundamentals, drives these trades. The main categories are scalping, day trading, and swing trading, each with distinct time horizons, tools, and risk profiles. Choosing the right approach depends on your available screen time, capital, and emotional discipline. Tier-one regulated brokers and strict risk controls are non-negotiable starting points for any retail trader.
What are the core short-term trading strategies and how do they differ?
Short-term trading covers three primary styles, each suited to different trader profiles and schedules.
Scalping operates on the fastest timeframe, from seconds to a few minutes. Scalpers execute dozens or hundreds of trades per day, targeting tiny price movements. This style demands lightning-fast execution, extremely low transaction costs, and near-perfect emotional discipline. A single moment of hesitation or a wide spread can wipe out an entire session's gains.

Day trading keeps all positions within a single trading session, closing everything before the market closes. Traders avoid overnight risk, which is the exposure to news or price gaps that occur when markets are closed. Day trading suits traders who can monitor screens for several hours and react quickly to intraday momentum shifts.
Swing trading holds positions from a few days to a few weeks. It is the most beginner-friendly approach because transaction costs are lower and traders do not need to watch charts all day. The tradeoff is overnight risk: a surprise central bank announcement or weekend geopolitical news can move a position against you before you can react.
Beyond these three, traders also use:
- Momentum trading: Buying assets that are already moving strongly in one direction, expecting the trend to continue.
- Breakout trading: Entering a position when price breaks through a defined support or resistance level with strong volume.
- Mean reversion trading: Betting that an asset that has moved sharply away from its average price will return to it.
| Strategy | Typical holding period | Screen time needed | Key risk |
|---|---|---|---|
| Scalping | Seconds to minutes | Constant | Transaction costs, speed |
| Day trading | Hours (intraday) | Several hours | Emotional fatigue |
| Swing trading | Days to weeks | 30–60 minutes daily | Overnight gaps |
| Momentum trading | Hours to days | Moderate | Trend reversals |
| Breakout trading | Minutes to days | Moderate | False breakouts |
Pro Tip: Start with swing trading for at least three months before moving to faster styles. The slower pace gives you time to build a journal, measure your edge, and understand your emotional reactions without the pressure of millisecond decisions.
Which technical analysis tools are essential for short-term strategy implementation?
Technical indicators are the primary decision tools for short-term traders. Experienced traders use moving averages, RSI, MACD, and VWAP to identify buy and sell signals based on momentum, breakouts, or mean reversion. Each indicator serves a specific function, and combining them produces more reliable signals than relying on any single one.
Moving averages (20-day and 50-day) smooth out price noise and reveal the underlying trend direction. When price crosses above the 20-day moving average, it often signals short-term bullish momentum. When the 20-day crosses above the 50-day, traders call this a "golden cross," a classic momentum confirmation signal.
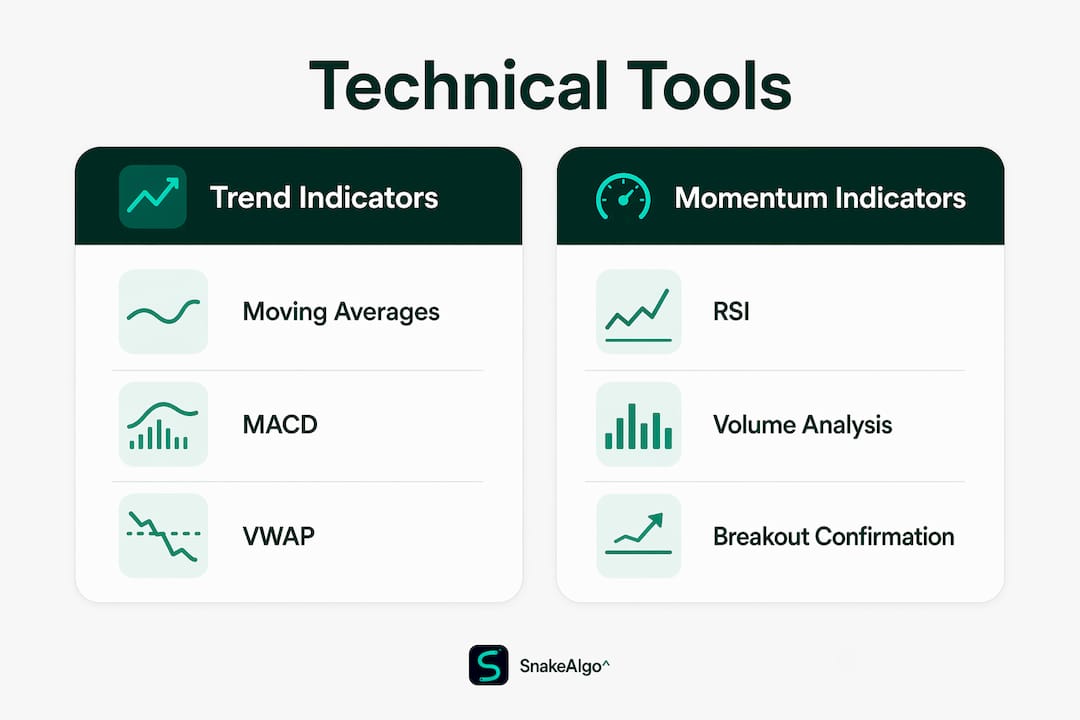
RSI (Relative Strength Index) measures how overbought or oversold an asset is on a scale of 0 to 100. Readings above 70 suggest overbought conditions; readings below 30 suggest oversold. RSI works best in ranging markets and loses accuracy during strong trending moves.
MACD (Moving Average Convergence Divergence) tracks the relationship between two moving averages. When the MACD line crosses above the signal line, it suggests bullish momentum. Traders use MACD divergence, where price makes a new high but MACD does not, as an early warning of trend weakness.
VWAP (Volume Weighted Average Price) is the average price an asset has traded at throughout the day, weighted by volume. Institutional traders use VWAP as a benchmark. Retail traders use it to identify whether price is trading at a premium or discount relative to the day's average activity.
| Indicator | Primary function | Best use case |
|---|---|---|
| 20/50-day moving average | Trend direction | Momentum and breakout trades |
| RSI | Overbought/oversold | Mean reversion setups |
| MACD | Momentum and divergence | Trend confirmation |
| VWAP | Intraday fair value | Day trading entries and exits |
| Volume | Confirms price moves | Breakout validation |
Volume analysis is the most underused tool among retail traders. A breakout on low volume is unreliable. A breakout on volume that is two to three times the average is a much stronger signal. Pairing volume with a momentum indicator like MACD gives you two independent data points confirming the same move.
Pro Tip: Never trade a breakout without checking volume. If volume does not confirm the price move, treat the breakout as a potential false signal and wait for a retest of the level before entering.
For traders who want a technical edge built into their workflow, reviewing a guide on technical analysis tools can sharpen your indicator selection process.
How do risk management and discipline impact short-term trading success?
Risk management is the single biggest difference between traders who survive and those who blow up their accounts. Most retail traders experience net losses primarily due to poor risk management and the absence of trade journals. Professionals follow one core rule: risk no more than 1% of account capital on any single trade.
That 1% rule is not arbitrary. It means a trader with a $10,000 account risks no more than $100 per trade. Even a losing streak of 10 consecutive trades only draws the account down by roughly 10%. Without this rule, a few bad trades can permanently damage your capital base.
Transaction costs are a silent account killer, especially in scalping. Spreads, commissions, and slippage compound quickly across dozens of daily trades. A scalper targeting a 5-pip gain on a 2-pip spread is already giving up 40% of the target profit before the trade even moves. Cost awareness is not optional. It is a core part of your risk management checklist.
Key discipline practices every short-term trader should follow:
- Journal every trade. Record entry price, exit price, reason for entry, and outcome. Treat your journal as a data tool, not a diary.
- Measure your edge. Track win rate, average risk/reward ratio, and maximum drawdown. Data-driven refinement beats gut-feel adjustments every time.
- Use a demo account first. Paper trading for 1–3 months lets you test setups in live market conditions without risking real capital.
- Set daily loss limits. If you lose 3% of your account in one day, stop trading. Emotional decisions after losses compound damage fast.
- Review weekly, not just daily. Weekly reviews reveal patterns in your mistakes that daily reviews miss.
Pro Tip: Your journal is your most valuable trading asset. Traders who review their journals weekly and adjust their rules based on data consistently outperform those who rely on memory and instinct.
For a deeper look at protecting your capital across different market conditions, the guide to risk management covers position sizing, stop placement, and drawdown control in detail.
How can traders combine market catalysts with short-term strategies effectively?
Macro catalysts like CPI inflation data, central bank statements, and geopolitical tensions create volatility that can completely override technical setups. A textbook breakout pattern can fail instantly when a surprise Federal Reserve comment hits the wire. Effective short-term traders monitor both chart patterns and scheduled economic events.
The most impactful catalyst types include:
- CPI and inflation data: These releases move currency pairs, indices, and commodities within seconds of publication. Scalpers and day traders often avoid trading in the 15 minutes before and after major releases.
- Central bank announcements: Federal Reserve, ECB, and Bank of England decisions on interest rates create sustained directional moves. Swing traders often position ahead of these events with defined stop levels.
- Geopolitical events: Tensions in regions like the Middle East can spike oil prices and safe-haven assets like gold rapidly. These moves are hard to predict but easy to trade once direction is confirmed.
- Earnings releases: For equity traders, quarterly earnings reports create sharp intraday moves. Day traders often use pre-market price action to gauge sentiment before the open.
The key limitation of technical signals in catalyst-driven environments is that price can gap through your stop loss. Slippage during high-volatility events means your actual exit price may be far worse than your planned stop. Reducing position size before known catalyst events is a practical way to stay in the trade without taking full risk.
Monitoring an economic calendar daily is non-negotiable. Knowing when CPI data, Fed minutes, or major earnings are scheduled lets you decide in advance whether to trade through the event, reduce size, or sit out entirely. The market outlook for July 13, 2026 illustrates how geopolitical and macro factors shaped intraday volatility in real time.
Key Takeaways
Short-term trading success depends on matching your strategy to your time horizon, controlling costs rigorously, and treating your trade journal as a performance database.
| Point | Details |
|---|---|
| Match strategy to your schedule | Scalping needs constant attention; swing trading fits traders with limited screen time. |
| Control transaction costs | Spreads and commissions erode small gains fast, especially in scalping. |
| Risk no more than 1% per trade | This rule keeps losing streaks from destroying your account permanently. |
| Journal and measure your edge | Track win rate, risk/reward, and drawdowns weekly to refine your approach. |
| Monitor catalysts alongside charts | Economic events can override technical setups; always check the calendar before trading. |
Why most traders fail before they find their edge
Most retail traders fail not because their strategy is wrong, but because they underestimate two things: the true cost of trading and the emotional weight of real losses. I have watched traders with solid technical setups blow up accounts simply because they never accounted for spreads, commissions, and slippage eating into every trade. The math looks fine on paper. It falls apart in live execution.
The second failure point is impatience. Beginners jump straight to scalping because it looks exciting and fast. The reality is that scalping is unforgiving to anyone without superb discipline and access to genuinely low costs. Starting with swing trading is not a compromise. It is the smarter path. You get real market exposure, real emotional pressure, and real feedback, but with enough time between decisions to actually learn from each trade.
The traders I have seen improve consistently share one habit: they treat their journal as a performance database, not a record of wins and losses. They ask "why did this trade fail?" not "did I win?" That shift from outcome thinking to process thinking is where real improvement starts. Effective short-term trading demands integrating clear strategic objectives with disciplined tactics. Random tactic use without a defined strategy leads to failure every time.
Persistence matters, but only when paired with honest self-assessment. Reviewing your data weekly, adjusting your rules based on evidence, and avoiding common beginner trading mistakes will compound into real improvement over months, not days.
— Tran
Scalping-algo tools built for short-term traders
Retail traders who want to implement disciplined short-term strategies without building every indicator from scratch have a direct path forward with Scalping-algo.

Scalping-algo offers a suite of premium TradingView indicators built in Pine Script v6, generating real-time, non-repainting buy and sell signals optimized for the 1m–15m timeframes where scalpers and day traders operate. The platform's Algo Master 3-indicator system combines confluence tools, volatility gating, and divergence detection to reduce emotional entry errors and tighten execution. For traders ready to put institutional-grade signals to work, the full indicator suite is available at Scalping-algo's main platform. The built-in backtesting, Discord community, and live trading sessions make it practical for both new and experienced traders.
FAQ
What is short-term trading and how long are positions held?
Short-term trading is the practice of buying and selling financial assets within a timeframe ranging from seconds to a few weeks. The three main styles are scalping (seconds to minutes), day trading (intraday), and swing trading (days to weeks).
What is the 1% risk rule in short-term trading?
The 1% rule means risking no more than 1% of your total account capital on any single trade. This limits the damage from losing streaks and keeps your account intact long enough to refine your strategy.
Which short-term strategy is best for beginners?
Swing trading is the most beginner-friendly short-term strategy because it requires less screen time, carries lower transaction costs, and gives traders time to analyze decisions without the pressure of fast execution.
How do transaction costs affect short-term trading profitability?
Transaction costs including spreads, commissions, and slippage compound quickly across many trades, especially in scalping. A scalper targeting small gains can lose the entire profit margin to costs if they are not carefully managed.
Why should traders use a trade journal?
A trade journal functions as a performance database, tracking win rate, risk/reward ratios, and drawdowns. Reviewing journal data weekly lets traders identify weaknesses and refine their strategy based on evidence rather than memory.