

The stochastic oscillator shows where price closed relative to its recent high-low range, on a scale of 0 to 100. Three rules get you trading it fast: identify %K (the raw line) and %D (the smoothed signal line), treat crossovers as signals only when the broader trend or another filter agrees, and never assume a reading above 80 or below 20 means an automatic reversal.
That last point trips up more traders than anything else on this list. A stock can sit above 80 for weeks during a strong uptrend, and if you shorted every "overbought" reading, you would have been stopped out repeatedly while the trend kept climbing.
Here's your working checklist before you act on any stochastic signal:
- Confirm which line is %K and which is %D on your chart (most platforms color them differently).
- Check whether price is trending or range-bound before trusting a crossover.
- Look for the crossover to happen near 20 or 80, not in the dead middle of the range.
- Confirm with a second tool: a moving average, RSI, or plain price action at support/resistance.
- Set your stop before you enter, not after.
Pro Tip: If the stochastic has been pinned above 80 for more than a handful of candles, stop watching it for a sell signal and start checking your trend indicator instead. That's a trend, not a setup.
Key Takeaways
The stochastic oscillator works because it measures where price closed within its recent range, and that reading is most trustworthy when combined with a trend filter rather than used alone.
| Point | Details |
|---|---|
| What it measures | The stochastic shows the close's position within its recent high-low range on a 0 to 100 scale. |
| Two lines to track | %K is the raw line; %D is typically its 3-period smoothed signal line used for crossovers. |
| Biggest caveat | Overbought and oversold readings above 80 or below 20 can persist through strong trends without reversing. |
| Settings rule of thumb | Shorter settings like 5-3-3 suit scalping; the 14-3-3 default suits daily swing trading. |
| Automate the process | Scalping-Algo's Command Center generates non-repainting stochastic-based signals with backtesting and Discord alerts built in. |
Table of Contents
- What Is a Stochastic Indicator and What Does It Measure?
- How to Calculate %K and %D Step by Step
- Fast, Slow, and Full Stochastic: Which One Should You Use?
- How to Read Stochastic Signals: Crossovers, Extremes, and Divergence
- Choosing Stochastic Settings by Timeframe and Asset
- A Step-by-Step Chart Walkthrough Using Stochastic
- Three Stochastic Strategies That Combine Filters to Cut False Signals
- Common Pitfalls and How to Manage the Risk
- Building Scans and Alerts for Stochastic Setups
- A Trader's Honest Take on Reading Stochastic Signals
- Put Your Stochastic Reading Skills on Autopilot
- Sources
What Is a Stochastic Indicator and What Does It Measure?
The stochastic oscillator compares the most recent closing price to the high-low range over a set look-back period, typically 14 bars, then expresses that position as a number between 0 and 100. A reading of 90 means the close landed near the top of its recent range. A reading of 10 means it closed near the bottom. That's the entire concept in one sentence, and everything else in this guide builds on it.
George C. Lane developed the stochastic oscillator in the late 1950s, and his original insight still holds: momentum tends to shift direction before price does. When a market is running higher but each new close creeps closer to the middle or bottom of its recent range, that's often an early warning that buying pressure is fading, even while the price chart still looks strong.
The indicator uses two lines. %K is the raw, faster line that reacts immediately to price. %D is a smoothed version, usually a 3-period simple moving average of %K, and it acts as the signal line you watch for crossovers. Think of %K as the instinct and %D as the second opinion that filters out noise.
The stochastic oscillator measures the current close's position within its recent trading range, not the speed or size of price moves. That distinction is why it works best in range-bound markets and needs extra caution during strong trends, according to LightningChart's technical breakdown.
Regulators like the CFTC don't endorse specific indicators, but the underlying math behind tools like the stochastic is public domain and widely documented, which is part of why it remains a staple across scalping and swing-trading toolkits decades after Lane introduced it. Platforms like Scalping-Algo build on that same open logic, layering non-repainting signal generation on top of classic oscillator math instead of reinventing it.
The stochastic shines in choppy, sideways markets where price oscillates between support and resistance. In a strong trend, it can flash "overbought" or "oversold" for extended stretches without price ever reversing. Divergence, where price makes a new high but the stochastic doesn't, is one of the more reliable signals the indicator offers, and we'll cover it in detail shortly.
How to Calculate %K and %D Step by Step
The %K formula is straightforward once you see it written out:
%K = ((Close − Lowest Low) / (Highest High − Lowest Low)) × 100
Here, "Lowest Low" and "Highest High" are pulled from your look-back period, commonly 14 candles. %D is then a 3-period simple moving average of %K, smoothing the raw line into something less jumpy. This is documented in detail on StockCharts' ChartSchool, which remains one of the clearest references on the exact math behind Fast, Slow, and Full variants.
Here's how to walk through it manually:
- Pull the closing price of the current candle.
- Find the highest high and lowest low across your look-back period (14 candles for the default setting).
- Plug those three numbers into the %K formula above.
- Repeat this for at least three consecutive periods so you have three %K values.
- Average those three %K values to get your first %D reading.
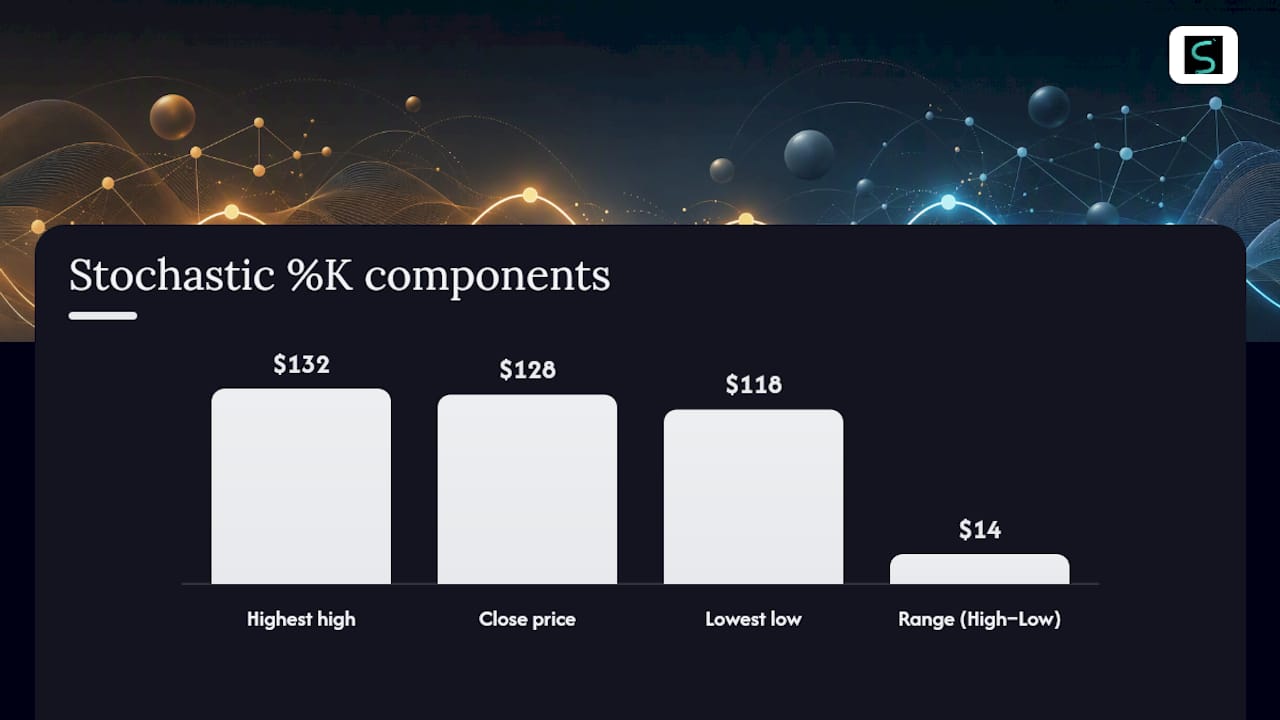
Let's run real numbers. Say over the past 14 candles, the highest high was $132 and the lowest low was $118, giving a range of $14. If the current close is $128, the math is: ($128 − $118) / ($132 − $118) × 100 = ($10 / $14) × 100 = 71.4. That candle's %K sits at 71.4, comfortably in neutral territory, not yet overbought.
If setting this up in a spreadsheet, you would calculate %K using the close price and recent high and low over your chosen look-back period, then average the %K values for %D
| Cell | Formula | Example value |
|---|---|---|
| B2 | Close | 128 |
| C2 | =MAX(High range, 14 periods) | 132 |
| D2 | =MIN(Low range, 14 periods) | 118 |
| E2 | =((B2-D2)/(C2-D2))*100 | 71.4 |
| F2 | =AVERAGE(E2:E4) for %D | (3-period average of column E) |
Pro Tip: Watch for flat ranges where the highest high equals the lowest low, which creates a division-by-zero error in your spreadsheet. Add a simple IF statement that returns 50 (the midpoint) when the range is zero, or switch to EMA-based smoothing if your charting platform supports it for a steadier signal line.
Fast, Slow, and Full Stochastic: Which One Should You Use?
The three variants differ only in how much smoothing gets applied, and that smoothing changes how quickly the lines react. Fast stochastic uses raw %K with minimal smoothing, which makes it twitchy and prone to false signals but quick to flag turns. Slow stochastic smooths the Fast %K once more before displaying it, cutting noise at the cost of a slight delay. Full stochastic lets you customize the smoothing period yourself, giving you control over how responsive or steady the lines behave, a flexibility ChartSchool highlights as one of its main advantages over the fixed Fast and Slow presets.
The notation you'll see everywhere, like 14-3-3 or 5-3-3, breaks down into three numbers: the look-back period, the %K smoothing, and the %D smoothing. A 14-3-3 setting uses a 14-period look-back with a 3-period smooth on %K and another 3-period smooth on %D. Shrink any of those numbers and the indicator gets faster and noisier. Stretch them and it gets slower but more reliable.
Here's how traders typically match variant to style:
- Scalpers on 1 to 5 minute charts often lean toward Fast or a tightened Full setting like 5-3-3 for quicker reads.
- Swing traders holding for days tend to prefer Slow or the standard 14-3-3 for fewer whipsaws.
- Position traders working weekly charts sometimes stretch to 21-5-5 or similar for maximum smoothing.
| Trading style | Suggested variant | Typical setting |
|---|---|---|
| Intraday scalping | Fast or Full | 5-3-3 |
| Swing trading | Slow | 14-3-3 |
| Position trading | Slow or Full | 21-5-5 |
How to Read Stochastic Signals: Crossovers, Extremes, and Divergence
A crossover happens when %K crosses above or below %D. %K crossing above %D is generally read as bullish momentum building; %K crossing below %D suggests momentum fading. But context matters enormously here. A crossover that happens down near 20 carries far more weight than one occurring at 50, because it's happening at a genuine price extreme rather than in the middle of the noise.

Overbought (above 80) and oversold (below 20) readings tell you the close is sitting near the top or bottom of its recent range, nothing more. LightningChart's analysis is direct about this: these thresholds are not guarantees of a reversal, and in a strong trend the oscillator can stay pinned at an extreme for a long stretch while price keeps moving in the same direction.
Divergence is where the stochastic earns its reputation as a genuinely useful tool rather than just a range-bound novelty. Bullish divergence appears when price prints a lower low but the stochastic prints a higher low, hinting that selling pressure is weakening even as price grinds down. Bearish divergence is the mirror image: price makes a higher high while the stochastic makes a lower high, warning that the rally is losing steam under the surface.
Before you act on any signal, run through this checklist:
- Is the crossover happening near an extreme (below 20 or above 80), not in the middle?
- Does price action agree, such as a candlestick reversal pattern at the same level?
- Is there a moving average or trend line nearby that supports the same conclusion?
- Has volume picked up on the reversal candle, adding weight to the signal?
Picture a daily chart where price has been sliding for three weeks, the stochastic dips below 20, curls up, and %K crosses above %D right as price prints a bullish engulfing candle at a prior support zone. That confluence, oscillator plus candlestick plus horizontal support, is a stronger setup than any single signal alone.
Pro Tip: A crossover with no confirmation is a coin flip. A crossover backed by price action, a support level, and a trend filter is a trade.
Choosing Stochastic Settings by Timeframe and Asset
Several popular presets for the stochastic oscillator involve setting the look-back and smoothing periods, with variations favored for different trading styles, and OANDA's trading guide lists these along with 8-3-3 as reasonable alternatives depending on how much noise you're willing to tolerate. Shortening the look-back period makes the oscillator more sensitive and generates more signals, but a larger share of them will be false. Lengthening it smooths the line and reduces signal frequency while improving reliability.
| Setting | Look-back | Best fit |
|---|---|---|
| 5-3-3 | 5 periods | Intraday scalping, high-frequency setups |
| — | 14 periods | Short swing trades, 1-4 hour charts |
| 14-3-3 | 14 periods | Daily swing trading, the industry default |
OANDA's guide also makes a point worth repeating: crossovers tend to be far more reliable when the market is consolidating rather than trending hard in one direction. That single observation should shape how you weight every signal this indicator gives you.
If you're testing a new parameter set, keep the methodology simple: pick one asset class, one timeframe, and one fixed rule set (say, only take crossovers below 20 with a trend filter), then run it across at least 100 historical setups before trusting it with real capital. Anything less than that sample size tells you very little about whether the edge is real or just a lucky streak.
A Step-by-Step Chart Walkthrough Using Stochastic
Here's how a clean trade using stochastic signals typically unfolds, step by step:
- Price has been trending upward on the daily chart, confirmed by price trading above its 200-period EMA.
- A pullback drives the stochastic down to 15, into oversold territory.
- %K crosses above %D while price simultaneously touches a prior swing-low support level.
- A bullish candlestick (hammer or engulfing pattern) forms on the same candle as the crossover.
- Entry is taken on the next candle's open, with a stop placed just below the recent swing low.
- Take-profit is set at the prior swing high, or scaled out in portions as price approaches resistance.
- The trade is logged with entry price, stop distance, and target, so the setup can be reviewed later.
A basic backtest of this kind of setup should record: the timeframe tested, the asset universe (say, 20 large-cap stocks or a handful of major forex pairs), the exact parameter set used (14-3-3 with a 200 EMA filter, for instance), the entry and exit rules, and two headline metrics, win rate and average reward-to-risk ratio.
Illustrative backtest note: a simple oversold-crossover-plus-trend-filter rule applied across a small basket of instruments might show a win rate in the 45 to 55 percent range with an average reward-to-risk near 1.5 to 1. These numbers are hypothetical and depend entirely on the sample, timeframe, and asset chosen. They are not a promise of future results.
Past performance never guarantees future outcomes, and a backtest run on a small sample or a single market regime can mislead you into overconfidence. Test wider, test longer, and treat every number as a starting hypothesis rather than a finished edge.
Three Stochastic Strategies That Combine Filters to Cut False Signals
1. Oversold upturn with a 200 EMA trend filter. Only take bullish stochastic crossovers below 20 when price sits above the 200-period EMA on the same or a higher timeframe. This single filter, recommended in OANDA's tutorial, eliminates a large share of the false signals that show up during downtrends. Entry on the crossover candle's close, stop below the most recent swing low, exit at the next resistance level.
2. Divergence plus horizontal support. Wait for bullish divergence (price lower low, stochastic higher low) to form exactly at a support zone you've already marked on the chart. This stacks two independent forms of evidence rather than relying on the oscillator alone. Size the position smaller than usual since divergence setups can take longer to play out, and set your stop just beyond the support level rather than tight against price.
3. Crossover confirmed by RSI or a moving average cross. Take a stochastic crossover only when RSI is also turning in the same direction, or when a fast moving average has just crossed a slower one. Investopedia's overview of the indicator specifically recommends pairing stochastic with trend indicators for exactly this reason, since a lone momentum reading is easier to fake than two tools agreeing at once. Reviewing an RSI divergence approach alongside your stochastic setup can sharpen this confirmation step considerably.
On higher timeframes, prioritize your trend filter first and treat the stochastic as the trigger, not the thesis. On lower timeframes where trends are shorter-lived, the stochastic can carry more weight on its own, but keep position sizes smaller to offset the higher noise.
Pro Tip: Never risk more than 1 to 2 percent of account equity on a single stochastic-based trade, regardless of how clean the setup looks. Even a well-filtered signal fails a meaningful percentage of the time.
Common Pitfalls and How to Manage the Risk
The single biggest mistake traders make is treating an overbought or oversold reading as an automatic reversal trigger. In a genuine trend, the oscillator can and will stay extreme for a long stretch. Wikipedia's documentation of the indicator's history even describes a phenomenon traders call a "stochastic pop," where a breakout continues right through an extreme reading instead of reversing, which is worth understanding before you fade every 80+ reading you see.
Other pitfalls worth flagging:
- Ignoring the broader trend and trading crossovers in isolation, especially against a strong directional move.
- Overtrading thinly-traded assets where price gaps and low liquidity produce erratic, unreliable readings.
- Using the same tight settings across every timeframe instead of adjusting for volatility.
- Chasing a signal after it's already played out several candles back.
Your risk-control checklist should include a hard stop-loss on every trade, sensible position sizing tied to your account size, confirmation across at least two timeframes when possible, and a bias toward taking signals that align with the dominant trend rather than fighting it.
Pro Tip: *Base your stop-loss and take-profit distances on the Average True Range (ATR) rather than a fixed dollar amount.
Building Scans and Alerts for Stochastic Setups
Once you understand the signal logic, the next step is automating the scanning so you're not staring at charts all day. Most charting platforms let you build custom scans using plain logic statements rather than code.
Common scan setups to build:
- Oversold upturn: %K crosses above %D while both are below 20.
- Overbought downturn: %K crosses below %D while both are above 80.
- Divergence alert: price makes a new 20-period low while the stochastic fails to make a new low.
- Trend-filtered crossover: bullish crossover below 20 combined with price trading above its 200 EMA.
To turn any of these into a real-time alert:
- Define your exact trigger condition (for example, %K crossing above %D below the 20 line).
- Add your trend or confirmation filter as a second condition that must also be true.
- Set the alert to notify you the moment both conditions are met, rather than requiring you to watch the chart manually.
- Route the alert to wherever you actually check first, whether that's a mobile push notification or a webhook into a messaging app.
Platforms built for this, including Scalping-Algo's Command Center, route real-time, non-repainting signals directly into Discord via webhook alerts, so a crossover-plus-filter setup fires the moment it forms instead of after you've missed the candle. Whatever tool you use, forward-test any new scan for a few weeks on paper before committing real capital, since a rule that looks clean on a backtest can still behave differently in live, fast-moving conditions.
A Trader's Honest Take on Reading Stochastic Signals
Most guides oversell how often clean stochastic signals actually show up. The truth is that a genuinely high-quality setup, extreme reading, crossover, and trend agreement all lining up together, might appear a handful of times a month on any single chart, not daily. Traders who expect constant action end up lowering their standards until they're trading noise instead of signal.
A workable routine looks like this: check the higher timeframe trend first (daily or 4-hour), then drop to your execution timeframe only when that trend is clear, and only take stochastic signals that agree with it. Set alerts rather than watching charts continuously, because staring at a screen waiting for a crossover is how traders talk themselves into forcing trades that were never really there.
The realistic expectation to set for yourself is this: a rules-based approach with a written checklist will outperform gut-feel trading over any meaningful sample size, but it won't produce a signal every session, and it shouldn't. If you find yourself wanting more frequent signals, that's a sign to widen your watchlist across more instruments rather than loosen your entry rules on the ones you already track. Tools like Scalping-Algo's alert and backtesting dashboard exist precisely for traders who want to scan more instruments without spending the entire session glued to a chart.
Put Your Stochastic Reading Skills on Autopilot
Reading %K and %D crossovers by eye works, but it doesn't scale past two or three charts at a time, and that's where most retail traders leave money on the table. Scalping-Algo built its Command Center specifically to close that gap: non-repainting buy and sell signals, a backtesting dashboard to validate parameter sets like 14-3-3 or 5-3-3 before you risk anything, and native webhook alerts that push straight to Discord the moment a filtered setup fires.

A practical starting point: set an oversold-upturn alert (stochastic crossover below 20 with a 200 EMA trend filter) across your entire watchlist, then run it through the backtesting dashboard to see how that exact rule set would have performed historically before you commit real capital. If you're weighing a fuller system, the Algo Master three-indicator suite layers confluence tools and volatility gating on top of signal generation so a single crossover isn't your only piece of evidence. Every script ships open-source in Pine Script v6, so you can verify exactly what triggers each alert rather than trusting a black box. Head to Scalping-Algo's indicator suite to see current plans and start building your first automated scan.
Sources
The sources below cover the formulas, default settings, and trading guidance referenced throughout this guide, and each is worth a direct read if you want to go deeper on the math or the historical context:
- Stochastic Oscillator (Fast, Slow, and Full) - ChartSchool
- Stochastic oscillator — Investopedia
- Stochastic Oscillator indicator — LightningChart
For readers exploring automation options beyond charting platforms alone, algorithmic execution tools such as Omega EA represent one path worth researching independently before committing capital to any automated system.