

Profit factor is total gross profit divided by absolute total gross loss, and any value above 1.0 means the sample made money. That's the whole formula. A profit factor of 1.5 means every $1 lost produced $1.50 in winning trades, but the number only means something when you know the trade count, the period, and whether it's calculated gross or net of costs. Higher isn't automatically better once sample size and fees enter the picture.
TL;DR:
- Profit factor should always be reported as net of costs, considering trade count and time period, to accurately reflect real strategy performance.
- Small sample sizes can produce misleadingly high or low profit factor numbers, so testing with larger trade sets is essential for trustworthy evaluation.
- Cost considerations such as slippage and commissions often reduce the net profit factor significantly compared to the gross calculation, which is often overstated.
- A profit factor over 1.6 to 2.0 generally indicates strong performance, but only if the sample size is large enough and costs are properly accounted for.
- Using rolling or segmented profit factor calculations helps identify regime-specific strengths or weaknesses rather than relying solely on lifetime figures.
Table of Contents
- What Profit Factor Measures and How the Formula Works
- How to Calculate Profit Factor Step by Step
- What Counts as a Good Profit Factor
- Where Profit Factor Falls Short
- Using Profit Factor to Actually Improve Your Trading
- Measuring Profit Factor in Real Backtest Workflows
- The Editorial Take: Why Retail Traders Get Profit Factor Wrong
- Measuring and Improving Your Profit Factor With Scalping-Algo
- Sources
- FAQ
What Profit Factor Measures and How the Formula Works
Profit factor takes two numbers off your trade log: the sum of every winning trade (gross profit) and the sum of every losing trade, expressed as a positive value (gross loss). Divide the first by the second and you get PF. TradingView's own definition confirms it's calculated strictly from realized, closed trades. Open positions don't count until they're closed.
There's a second way to read the same number that traders often miss: PF = 1 + (Net Profit / Gross Loss). That rearrangement shows exactly why PF climbs so fast once a strategy turns net positive. Small improvements in net profit produce outsized jumps in PF when gross loss stays flat.
A few distinctions matter before you calculate anything:
- Gross profit is the sum of winning trades only, with no losses netted in.
- Gross loss is the sum of losing trades, always expressed as an absolute number.
- Total PF looks at the whole trade sample; average-trade PF divides average win by average loss, which is a different (and sometimes misleading) calculation.
How to Calculate Profit Factor Step by Step
Three steps, every time:
- Sum all winning trades to get gross profit.
- Sum all losing trades and take the absolute value to get gross loss.
- Divide gross profit by gross loss.
Say a strategy closes a moderate number of trades. Winners total a certain amount. Losers total a lesser amount. Gross profit factor is total gross profit divided by total gross loss.
Now add reality. Consider that commissions and slippage add friction costs which reduce the net profit factor compared to gross profit factor, sometimes substantially. That's a very different strategy on paper than the 1.5 you started with, and it's the number that actually predicts what happens in your account. NexusFi's guidance on cost-adjusted PF makes the same point: gross PF flatters almost every strategy, and net PF is the only one worth trusting.
Pro Tip: Calculate PF three ways: per instrument, per strategy, and on a rolling 90-day window. A strategy with strong all-time PF can be quietly bleeding in the current regime, and rolling PF is what catches that before your equity curve does.
What Counts as a Good Profit Factor
Rough bands exist, but treat them as starting points, not scorecards:
- 1.0 is break-even. You're not losing, but you're not compensated for the risk.
- Values between about 1.3 and 1.6 can indicate a workable trading edge.
- Values around 1.6 to 2.0 suggest strong performance.
- Values above 2.0 are excellent but should be examined carefully for sample size or outliers.
Quantified Strategies notes that these bands shift depending on sample size and strategy type, and that's the part most traders skip past. High volume trading strategies may require less edge per trade since performance compounds over many trades, unlike lower frequency strategies. Instrument costs matter too: a futures scalp with high round-turn fees needs a materially higher net PF just to survive the friction that a low-cost equity swing trade barely notices.
Reporting profit factor should always include whether the value is gross or net of costs, the number of trades analyzed, and the time period covered. "PF 1.8" means almost nothing on its own. "Net PF 1.8 over 1,200 trades, Q1 through Q4" is a claim you can actually evaluate.
Where Profit Factor Falls Short
Profit factor tells you one thing well: whether winners outweighed losers in a given sample. It stays silent on almost everything else that determines whether a strategy is survivable.
- It ignores drawdown. A PF of 2.0 built on a portfolio that dropped 40% before recovering is a very different risk profile than the same PF with a shallow, steady equity curve.
- It ignores trade frequency and distribution skew. One outsized win can carry an entire sample's PF, meaning the "edge" barely exists once that single trade is removed.
- It's distorted by small samples. Small trade samples can produce misleadingly high or low profit factor numbers due to chance.
Always run the number twice: once with the full trade set, once with the top and bottom outliers stripped out. If PF collapses when you remove your single best trade, you don't have a strategy, you have a lottery ticket. Position size also skews raw dollar PF, so normalizing trades into R-multiples (risk units instead of dollars) makes PF comparable across setups with different stop distances.
Pro Tip: If your PF is calculated in raw dollars, recalculate it in R-multiples before comparing two strategies side by side. A strategy risking $500 per trade and one risking $50 per trade can post identical dollar PF for completely different reasons.
Using Profit Factor to Actually Improve Your Trading
PF is a diagnostic, not a verdict. It answers one narrow question: did winners outweigh losers? Win rate answers a different question (how often did you get paid), expectancy tells you the dollar value of an average trade, and drawdown tells you how much pain you'd sit through to realize that edge. Pairing PF with those metrics gives a fuller picture than any single number can.
Turn PF into a working loop:
- Calculate net PF segmented by setup, session, and market regime. A strategy's blended PF often hides the fact that it only works during trending sessions and quietly loses during chop.
- Add realistic costs before trusting any number. Commissions, spread, and slippage all belong in the calculation, not as an afterthought.
- Run walk-forward or out-of-sample tests. A PF built entirely on the data you optimized against tells you nothing about live performance. Reviewing how to backtest trading strategies properly is worth doing before you trust any backtested PF at all.
- Monitor rolling PF, not just lifetime PF. A strategy that's decayed over the past month will still show a healthy PF if its first six months were strong.
Pro Tip: Keep a segmented log by session (London, New York, Asia) even if you don't segment anything else. PF differences across sessions are often the single clearest signal that a setup has an edge in specific conditions rather than universally.
Measuring Profit Factor in Real Backtest Workflows
Backtesting platforms, TradingView included, calculate PF from closed trades and usually label it clearly, but it's worth confirming whether your platform reports it gross or net by default. Most don't factor in your actual commission and slippage assumptions unless you enter them, which means the PF sitting in your strategy tester report is almost always the optimistic version.
For scalpers specifically, entry timing does more damage to net PF than almost any other variable. A signal that repaints after the candle closes can show a beautiful backtested PF that never materializes live, because the entry price you'd have actually gotten differs from the one the backtest assumes. Non-repainting signals confirmed on candle close remove that gap, which is a big part of why precise entry timing matters more for lower timeframes than it does for swing strategies with wider stops.
A few reporting habits carry over directly from backtesting into live tracking:
- Report PF net of realistic commissions and slippage, never gross alone.
- State trade count and date range next to every PF figure.
- Recalculate PF with outliers removed before trusting a backtest's headline number.
The Editorial Take: Why Retail Traders Get Profit Factor Wrong
Most retail traders treat profit factor like a report card grade: get it above 2.0 and you've won. That instinct is backwards. A PF of 1.4, net of costs, on 1,500 trades across three market regimes tells you far more than a PF of 3.0 built from 40 trades during one trending month. Sample size does more work in this metric than most guides admit, and a strategy's true PF often looks less impressive the moment you feed it enough data to be honest.
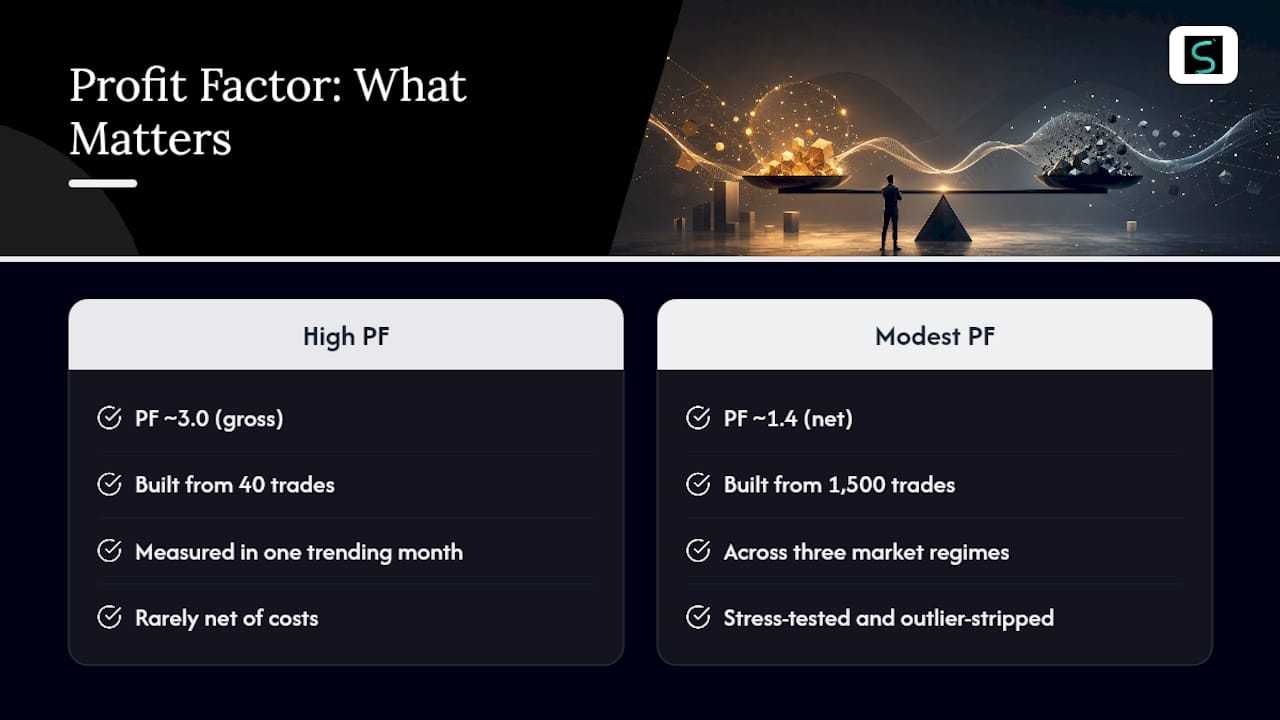
The bigger blind spot is cost. Gross PF is essentially a marketing number. It's the version that shows up in vendor pitches and forum screenshots, and it's almost never the number a live account produces once spread, slippage, and commissions take their cut. Retail traders comparing strategies on gross PF are comparing fiction to fiction. The only PF worth acting on is net, segmented by regime, and stress-tested with outliers stripped out.
If there's one habit worth adopting immediately, it's this: stop treating PF as a single number and start treating it as a question you ask repeatedly, across time windows, sessions, and cost assumptions. The strategies that survive that repeated questioning are the ones worth trading. The ones that only look good once, in one backtest, under one set of assumptions, usually aren't.
— Tran
Measuring and Improving Your Profit Factor With Scalping-Algo
Once you know your net PF is the number that matters, the next problem is getting entries clean enough that your backtested PF actually shows up in your live account. Scalping-Algo builds toward exactly that gap.

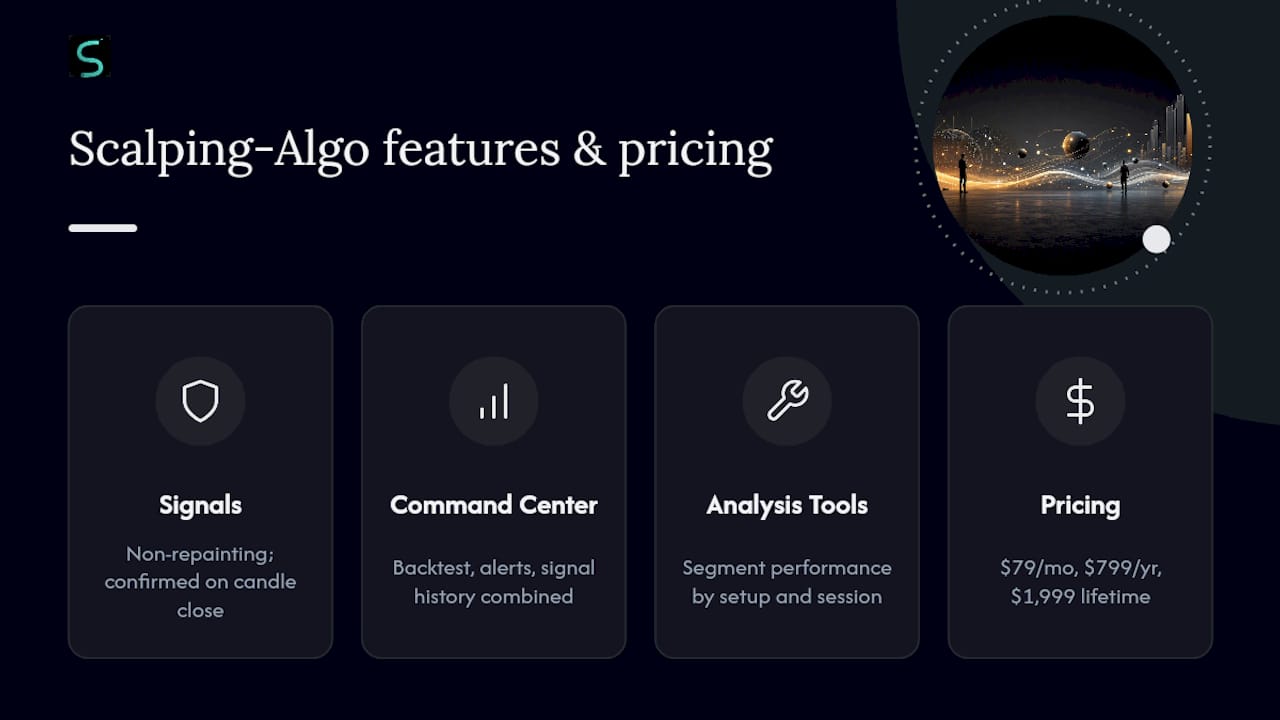
The suite runs on non-repainting signals confirmed on candle close, which removes the phantom-entry problem that quietly inflates backtested PF for scalpers trading 1 minute to 15 minute charts. The Command Center dashboard combines backtesting, alerts, and signal history in one place, so you can pull trade-count and period figures for your PF reports without stitching together spreadsheets by hand, leveraging insights from the StockPilot Investor Insights Blog on portfolio-level profit factor and analytics tools. Tools like the Smart Scalping Signals indicator and the Edge Finder backtesting suite are built specifically to help you segment performance by setup and session, the same segmentation this article recommends for finding where your edge actually lives. Discord webhook alerts handle execution timing so slippage surprises stop eating into your net PF between backtest and live trade.
Plans run $79 per month, $799 per year, or $1,999 for lifetime access. Check the full indicator lineup and current pricing on the Scalping-Algo site before your next backtest cycle.
This article is general information, not a substitute for advice from a qualified financial advisor. Consult a qualified financial professional about your own circumstances before acting on anything here.
Sources
- Profit Factor: The One Ratio That Tells You If Your Winners Are Big Enough - NexusFi Academy
- Profit factor — Quantified Strategies
- Using Profit Factor to Assess Portfolio Performance — Option Alpha
FAQ
Is a Profit Factor of 2.0 Good?
A PF of 2.0 is generally considered strong to excellent, but only when it holds up net of trading costs across a large enough sample. On a handful of trades, a 2.0 PF can evaporate the moment you add realistic commissions or remove one lucky outlier.
Is a Profit Factor of 1.5 Good?
Yes, a net PF of 1.5 is typically viewed as a solid, workable edge, sitting comfortably in the 1.3 to 1.6 range that traders commonly treat as a real statistical advantage rather than noise.
Is 1.3 a Good Profit Factor?
A PF of 1.3 sits at the low end of a workable edge, meaning the strategy is profitable but has little room for cost creep or a rough stretch of trades. It's worth watching closely rather than scaling up immediately.
How Is Profit Factor Calculated?
Profit factor equals total gross profit divided by absolute gross loss, using closed trades only. Always calculate it both gross and net of commissions and slippage, since the two numbers can differ significantly.