
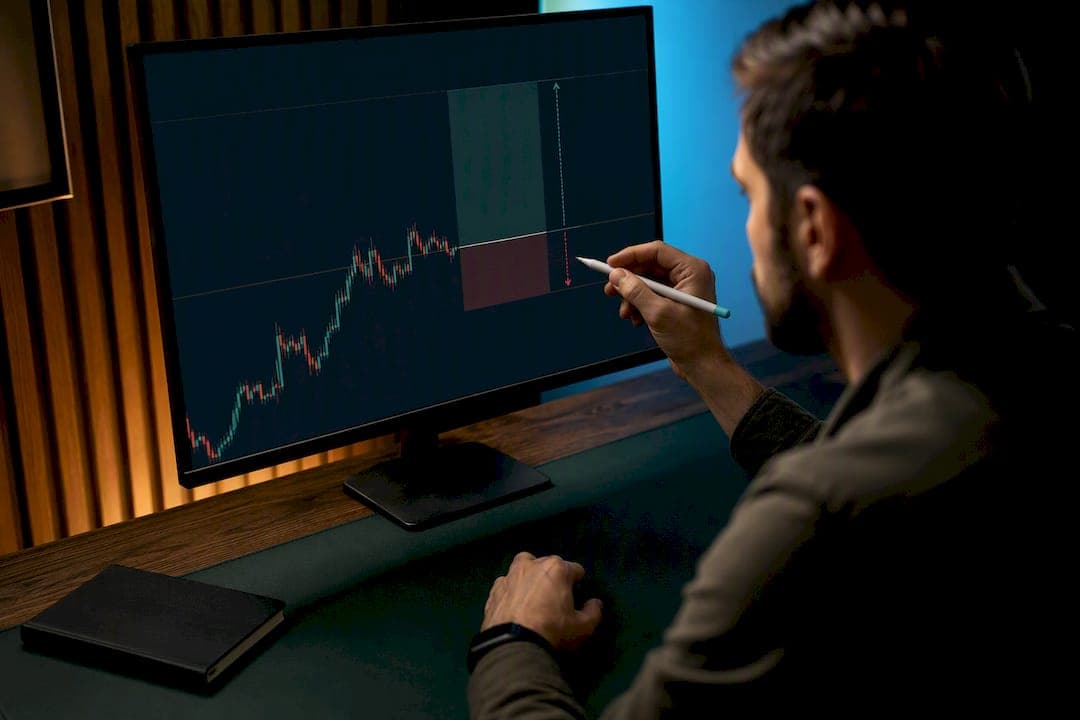
A 1:2 risk reward ratio is a solid baseline for most retail traders because it only demands a 33.33% win rate to break even. That's a low bar. The catch is that "breakeven" isn't the goal. Real profitability still comes down to your actual win rate, your fees and spread, and whether you have the discipline to let winners run to target instead of grabbing profit early. The sections below show you how to calculate it, test it, and execute it without flinching.
TL;DR:
- A 1:2 risk reward ratio requires at least a 36% win rate after accounting for spreads and commissions to remain profitable.
- Achieving the desired 2R target depends heavily on market volatility and time frame, often necessitating adjustments to stop and target levels.
- Discipline and pre-trade planning are critical; closing early or widening stops can turn a profitable ratio into a losing one.
- Volatility conditions and asset types influence the feasible reward targets, with scalpers favoring closer ratios like 1:1 and swing traders targeting 2:1 or higher.
- Proper backtesting over at least 100 trades helps confirm whether a 1:2 strategy can sustain a positive expected value in real trading.
Table of Contents
- What Is a Risk Reward 1:2 Ratio and How Do You Calculate It?
- How Win Rate and Risk Reward Combine to Drive Expected Value
- How to Plan and Size a 1:2 Trade Step by Step
- Pros, Cons, and the Mistakes That Sink a 1:2 Plan
- Charting Tools That Help You Plan and Track 1:2 Trades
- How Volatility and Market Conditions Change a 1:2 Plan
- Staying Disciplined With a 1:2 Ratio When It's Hard
- Diversification and Drawdown Limits Alongside a 1:2 Ratio
- Adjusting the Ratio for Different Assets and Trading Styles
- Backtesting a 1:2 Strategy Before You Trade It Live
- Author Perspective: When 1:2 Earns Its Place in a Plan
- Scalping-Algo: Tools That Help You Plan and Enforce 1:2 Trades
- Sources
- FAQ
What Is a Risk Reward 1:2 Ratio and How Do You Calculate It?
Risk reward 1:2 means you're willing to lose $1 for every $2 you're trying to make. Risk comes first in the ratio by convention, always. The math is simple, but the setup discipline behind it is where most traders lose the plot.
Here's how you build the trade:
- Entry price: where you get filled
- Stop loss: your risk, measured in dollars or pips from entry
- Take profit: set at exactly 2x that distance from entry
- Position size: calculated backward from how much dollar risk you're willing to take
Say you buy a stock at $50.00, place your stop at $49.00 (a $1.00 risk), and set your target at $52.00 (a $2.00 reward). That's a clean 1:2. In forex, the same logic applies in pips: risk 20 pips, target 40.
The breakeven win rate formula is 1 ÷ (1 + R), where R is your reward multiple. For 1:2, that's 1 ÷ 3, or 33.33%. Win one in three trades and you're flat before costs. But spread and commissions eat into that math, so many practitioners plan for a practical threshold closer to 36% to 38% rather than the textbook number.
How Win Rate and Risk Reward Combine to Drive Expected Value
The ratio alone tells you nothing about whether a strategy makes money. Win rate and reward to risk ratio work together to determine expected value, and a trader who ignores one while obsessing over the other is flying half blind.
The expected value formula is:
EV = (Win rate × Average win) − (Loss rate × Average loss)
Plug in a 1:2 setup and run the numbers:
- A hypothetical 40% win rate at 1:2 produces positive expected value.
- A hypothetical 30% win rate at 1:2 falls below breakeven and leads to losses.
- A hypothetical 35% win rate at 1:2 shows thin but positive expected value, assuming fees don't wipe it out.
One in three winners at 1:2 keeps you at breakeven; drop just five points to 28%, and you're losing money even though the ratio never changed.
That's the trap with chasing bigger reward multiples. Push for 1:3 or 1:4 and your win rate typically drops, because wider targets need more room to run and more market cooperation to get there. A scalper working 1 to 5 minute charts might realistically win 55% to 60% of trades at 1:1, while a swing trader holding for days might only hit 30% to 35% at 1:3. The ratio has to match the timeframe and the setup, not the other way around.
How to Plan and Size a 1:2 Trade Step by Step
Theory is cheap. Execution is where 1:2 either pays off or falls apart. Here's how to build the trade before you ever click buy.
Step 1: Define your levels first.
- Scalper (1 to 5 min chart): entry $100.00, stop $99.80 (20 cents risk), target $100.40 (40 cents reward)
- Intraday trader (15 min to 1 hour chart): entry $100.00, stop $99.00 ($1.00 risk), target $102.00 ($2.00 reward)
- Swing trader (daily chart): entry $100.00, stop $95.00 ($5.00 risk), target $110.00 ($10.00 reward)
Step 2: Size the position from dollar risk, not gut feel. Predefining your stop and target before entry, then sizing around dollars at risk rather than percentages alone, is standard practice for a reason. If you're risking 1% of a $10,000 account, that's $100 at risk per trade. Divide $100 by your per-share or per-unit stop distance to get position size. A $1.00 stop means 100 shares; a $5.00 stop means 20 shares. Our forex risk management guide walks through the same math for pip-based instruments.
Step 3: Journal every trade. Record planned R, realized R, and the gap between them. If your planned 1:2 trades keep closing at 0.6R because you exit early, that's a discipline problem, not a strategy problem. Our guide on setting stop loss and take profit levels covers the mechanics in more depth.
Pro Tip: Track planned R versus realized R for at least 30 trades before you touch your ratio. If realized R consistently lags planned R, the fix is usually behavior, not math.
Pros, Cons, and the Mistakes That Sink a 1:2 Plan
A 1:2 ratio has real strengths. It's forgiving of losing streaks; you can lose six or seven trades in a row and still recover fully with three or four winners. Position sizing is straightforward, since the math scales cleanly whether you're trading $500 or $50,000.
It has limits too. On very tight intraday moves, especially in low-volatility conditions, a realistic 2R target may simply not exist within the session. High-commission instruments (some futures contracts, certain options spreads) can eat a meaningful chunk of a 1R stop, distorting the math before the trade even starts.
The behavioral traps matter more than the ratio itself:
- Moving the stop wider mid-trade turns a defined 1:2 into an undefined risk, quietly.
- Cutting winners early, closing at 1R "to lock in profit" when the plan called for 2R, systematically converts a profitable EV into a losing one.
- Ignoring fees and spread in the breakeven calculation, which pushes your real threshold above the textbook 33.33%.
- Averaging losers instead of taking the stop, which is a different problem wearing a risk management costume.
Our trader risk management checklist is built specifically to catch these before they become a pattern.
Charting Tools That Help You Plan and Track 1:2 Trades
Planning a 1:2 trade on paper is one thing. Watching it play out on a live chart, with your position size already calculated and the outcome logged automatically, is another. A handful of TradingView scripts are built specifically for this.
Look for these features:
- Click-to-place entry, stop, and target levels directly on the chart
- Automatic position-size calculation from account risk percentage
- Non-repainting, confirmed-bar grading, so a signal doesn't quietly change after the fact
- Plan history that stores every trade so you can compare planned R to realized R over time
| Tool | Core feature | Best for |
|---|---|---|
| Risk-Reward Visualizer (Dots3Red) | Plan history and conservative same-bar resolution rules | Traders who want a running record of planned vs. realized R |
| Risk Reward Visualizer (AGPro Series) | TP ladders at 1R, 2R and beyond, plus MFE/MAE tracking | Traders using hybrid exits or trailing to breakeven |
| Risk-Reward Position Planner | On-chart position sizing tied to stop distance | Traders who want size and levels calculated together |
An indicator that resolves plans on confirmed bars removes the guesswork of "did that actually hit target or did I imagine it." Over 50 or 100 logged trades, that record tells you whether your realized R matches your planned 1:2, or whether execution is quietly costing you a full reward multiple per trade.
How Volatility and Market Conditions Change a 1:2 Plan
Volatility decides whether a 1:2 target is a reasonable ask or a fantasy. In a trending market with expanding range, price can cover a 2R distance in minutes. In a choppy, low-volatility session, the same distance might take hours, if it happens at all, and your stop is more likely to get clipped by noise before the move even starts.
This matters most on lower timeframes. A 1 minute or 5 minute scalp during a quiet midday lull often can't generate the room a 2R target needs, no matter how clean the setup looks. The same setup during a news-driven expansion, like a Consumer Price Index release or an earnings gap, can hit 2R in a fraction of the time. Adjusting stop distance to current volatility, using something like average true range instead of a fixed pip or dollar amount, keeps the ratio realistic instead of arbitrary.
Wider stops also change your position size math. A volatile session demands a wider stop to avoid getting shaken out by normal noise, which means a smaller position size to keep dollar risk constant. Traders who keep position size fixed while volatility rises are quietly taking on more risk per trade than their plan intends.
The practical rule: measure the recent range before setting a 1:2 target, not after. If the instrument hasn't moved 2R in either direction over the last several sessions, forcing a 2R target is a bet on a volatility expansion that may not come. Scale the ratio to conditions, or scale the timeframe instead, holding the trade longer to give the same distance more room to develop.
Staying Disciplined With a 1:2 Ratio When It's Hard
The math on a 1:2 plan is simple. Sticking to it under pressure is not. Every losing trade whispers that the stop was wrong, and every winning trade whispers that you should take profit now, before the market takes it back. Both impulses, followed consistently, quietly destroy the expected value the ratio was built to protect.
Cutting winners early is the more expensive habit, and it's the one traders rationalize the most. Closing a trade at 1R "to be safe" when the plan called for 2R doesn't feel like a mistake in the moment. It feels like prudence.
Losing streaks test the other side of discipline. Traders who abandon a sound plan after a normal losing streak, and traders who widen stops mid-trade to avoid admitting a loss, are both reacting to variance as if it were signal.
The fix isn't willpower. It's structure. Predefining every level before entry, sizing the position before you second-guess it, and logging the outcome regardless of how the trade felt in the moment all remove the decision point where emotion usually wins. A pre-trade checklist works because it forces the plan to exist on paper before the chart starts moving against you.
Diversification and Drawdown Limits Alongside a 1:2 Ratio
A 1:2 ratio manages risk on a single trade. It says nothing about what happens when five correlated trades go wrong at once. That's where portfolio-level rules take over, and skipping them is one of the more common gaps in an otherwise sound trading plan.
Diversification across uncorrelated instruments, or at least across setups that don't all fail for the same reason, keeps a single bad session from compounding into a bad month. Two long positions in correlated currency pairs during a Dollar Index spike aren't two independent 1:2 trades; they're one trade wearing two tickets, and the risk should be sized accordingly.
Maximum drawdown limits work as a circuit breaker. These limits don't replace the 1:2 math on individual trades; they cap how much damage a losing streak can do while the ratio's expected value plays out over a larger sample.
Position correlation and drawdown limits are the risk management layer that individual 1:2 planning can't cover on its own. A checklist that includes both, alongside your per-trade levels, closes the gap between a mathematically sound ratio and a portfolio that survives a rough month intact.
Adjusting the Ratio for Different Assets and Trading Styles
A fixed 1:2 target doesn't fit every instrument or every timeframe equally well. Typical targets shift by trading style: scalpers often work closer to 1:1 given how little room a one-minute or five-minute chart provides, day traders commonly land in the 1.5:1 to 2:1 range, and swing traders holding for days or weeks can reasonably target 2:1 to 3:1 because they have more price action to work with.
Asset class matters just as much as timeframe. Highly liquid major forex pairs during active sessions can support tighter stops and more precise 1:2 targeting, since spread is thin and price action is orderly. Crypto, with its wider swings and thinner order books on smaller-cap coins, often needs wider stops just to avoid getting shaken out by normal noise, which changes the dollar math even when the ratio stays the same. Futures and options carry their own commission structures, and a 1R stop that's mostly eaten by fees needs a different baseline than a stock trade where commissions are near zero.
The practical approach is to treat 1:2 as a starting point, not a rule carved in stone. A scalper forcing a 2R target on a 1 minute chart is fighting the timeframe. A swing trader capping targets at 1.5R is leaving edge on the table when daily charts naturally support more room. Match the ratio to what the instrument and holding period can actually deliver, then let your logged win rate tell you if the fit is working.
Backtesting a 1:2 Strategy Before You Trade It Live
Running a 1:2 plan on historical data before risking real money answers the one question theory can't: does your actual setup produce a win rate anywhere near what the math requires.
The process is straightforward. Pick a defined entry trigger, apply a consistent 1:2 stop and target to every historical instance, and count wins versus losses across at least 100 trades, more if the instrument trades frequently.
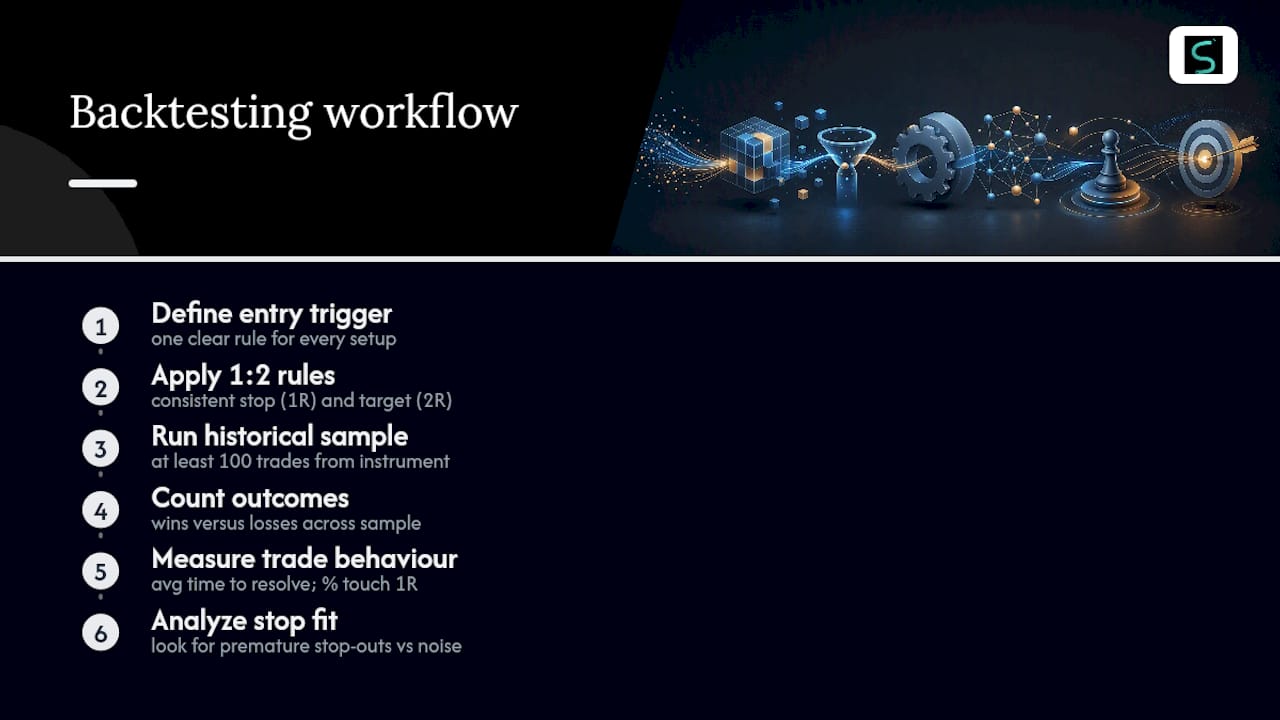
Track more than the win rate. Note the average time each trade took to resolve, since that tells you whether the strategy fits a scalping, intraday, or swing timeframe in practice, not just in theory. Note how often price touched 1R before eventually hitting the 2R target or the stop, since that reveals how much the plan depends on riding out drawdown within the trade itself.
Backtesting also exposes the gap between planned and achievable R. A strategy that requires a stop tighter than the instrument's typical noise level will show a string of premature stop-outs in the data, a pattern easy to miss when eyeballing a few charts but obvious across a full backtest run. That's the value of the exercise: it turns "this ratio should work" into a number you can actually check against your own edge before it costs you real capital.
Author Perspective: When 1:2 Earns Its Place in a Plan
I default to 1:2 on intraday setups where volatility supports it, and I widen to 1:3 only when a trend is clearly established and the structure gives the trade room to run. Tightening to 1:1 makes sense on fast scalps where 2R simply isn't available in the time the setup allows. None of that is a fixed rule. It's a starting point that gets adjusted once the data says otherwise.
Track planned R against realized R for every trade you take, then let that record, not a preference for round numbers, decide your ratio. That's the same logic behind how Scalping-Algo frames performance tracking: the number that matters is what actually happened, not what the plan intended.
— Tran
Scalping-Algo: Tools That Help You Plan and Enforce 1:2 Trades
Everything in this article, the entry and stop math, the position sizing, the journaling discipline, is easier to execute when your chart does the heavy lifting instead of your memory. Scalping-Algo's suite is built around that exact gap: non-repainting signals confirmed on candle close, on-chart risk zones you can see before you click, and real-time Discord alerts so a 1:2 plan doesn't depend on staring at a screen all day.
The Smart Scalping Signals indicator is built for exactly the lower-timeframe entries covered in the scalping and intraday examples above, while Edge Finder adds confluence for traders who want a second confirmation layer before sizing a position. Every script is open-source, so you can see exactly how a signal is generated rather than trusting a black box. Before you size a single trade, read the risk disclosure so you understand what these tools do and don't promise.
If you're ready to see how visual R zones and non-repainting signals fit into your own 1:2 plans, check the plans and pricing for Monthly ($79/month), Yearly ($799/year), or Lifetime ($1,999 one-off) access.
Sources
- Risk/Reward Ratio — Investopedia
- Risk and Reward Ratio: A Day Trading Guide (2026) — TradingSim
- Risk-Reward Visualizer — Dots3Red — TradingView
FAQ
Is a 1:2 risk to reward ratio good?
Yes, for most retail strategies. It only needs a 33.33% win rate to break even, which gives you room for a losing streak while still building positive expected value if your actual win rate lands anywhere near 40%.
Is a risk reward ratio of 1:3 good?
It suits swing and position trades better than fast scalps.
What is a good risk reward ratio?
There's no single correct answer. A good ratio matches your trading style and timeframe: closer to 1:1 for scalping, 1.5:1 to 2:1 for day trading, and 2:1 to 3:1 for swing trading, backed by a logged win rate that actually supports positive expectancy.
What does a risk ratio of 1:2 mean?
It means you're risking one dollar (or one unit of currency) to potentially make two. Set your stop at half the distance of your target from entry, and the ratio holds regardless of the instrument or timeframe.
How much does Scalping-Algo cost?
Scalping-Algo offers Monthly access at $79/month, Yearly at $799/year, and Lifetime access as a one-time $1,999 payment, all detailed on the pricing page.