

Every trade needs two prices before you enter: where you get out if you're wrong, and where you get out if you're right. A stop-loss limits what you lose; a take-profit locks in what you've earned. Set both before you click buy or sell, and you remove the two worst decisions traders make under pressure.
Here's the rule-of-thumb to carry into every session:
- Always set a stop-loss. No exceptions, no "I'll watch it."
- Target a minimum 1:2 risk/reward ratio — risk $1 to make $2 — unless your tested strategy shows a different ratio is profitable.
- Size your stop using Average True Range (ATR) so it reflects actual market volatility, not a round number you picked from habit.
- Use a tool like Scalping-algo to project TP/SL levels directly on your chart before entry.
Pro Tip: Set your stop-loss first, then calculate position size to keep risk at 1–2% of account balance. Only after that, place your take-profit at the level your R/R target requires.
Table of Contents
- Why use stop-loss and take-profit orders — and where they fall short
- How to set stop-loss and take-profit levels that actually hold
- Worked examples: calculating stop distance, TP targets, and position size
- Common mistakes traders make with TP/SL and how to fix them
- How to test whether your TP/SL rules actually work
- Key Takeaways
- The part most traders skip — and why it costs them
- Scalping-algo projects your TP and SL levels automatically
- Useful sources and further reading
Why use stop-loss and take-profit orders — and where they fall short
The case for using both orders together is mostly about discipline and trading risk management. When your exit prices are pre-set, you don't have to make a decision while the trade is moving against you — the moment when most traders make their worst calls.
Advantages:
- Automated risk control: your maximum loss per trade is defined before you enter.
- You can step away from the screen without babysitting every tick.
- Enforces your R/R ratio — if your TP is always at least 2× your SL distance, your math works even with a sub-50% win rate.
- Removes the temptation to let a loser run or cut a winner short.
Disadvantages:
- Gapping risk: in stocks, crypto, or news events, price can jump past your stop and fill significantly worse than your intended level.
- A rigid take-profit can cost you when a trend runs far beyond your target — you exit at $2 gain while the move delivers $8.
- Tight stops in noisy, choppy markets get triggered by normal volatility, not by the trade being wrong.
Consider two quick scenarios. Trader A enters EUR/USD with no stop and no target, planning to "watch it." Price drops 40 pips, they freeze, and exit at 60 pips down when panic sets in. Trader B enters the same trade with a 20-pip stop and a 40-pip target. Price dips 18 pips, bounces, and hits the target. Trader B never touched the keyboard after entry.
The difference isn't skill. It's structure.
How to set stop-loss and take-profit levels that actually hold
There are four repeatable methods. Each fits different market conditions and timeframes.
Method 1: Technical levels (support, resistance, structure)
Place your stop-loss just beyond a key structural level — below support for longs, above resistance for shorts. "Just beyond" means a small buffer of 5–15 pips (forex) or 0.1–0.5% (stocks/crypto) past the level, not directly on it. Stops sitting exactly on round numbers or obvious swing lows get hunted. Forex-basics.com flags this as one of the most common placement errors.
Your take-profit then targets the next significant level in the trade's direction — the next resistance zone for a long, the next support for a short. The Balance Money recommends setting TP at the next technical target rather than a fixed pip count, since markets respect levels more than arbitrary distances.
Method 3: Fixed percentage risk
Risk 1–2% of your account per trade, then back-calculate the stop distance from your position size. This is the most mechanical method and works well when you don't have a clear structural level nearby. It keeps your account drawdown predictable across a run of losses.
Method 4: Risk/reward ratio
Set your stop first (using methods 1, 2, or 3), then place your take-profit at a distance that gives you at least a 1:2 R/R. With a 1:2 ratio, you only need roughly a 40% win rate to be profitable over time — a realistic target for most retail strategies.
Partial profit-taking is a practical middle ground: close 50% of the position at 1:1 R/R, move stop to breakeven, and let the remainder run to the full 1:2 or 1:3 target.
Before committing to any levels, check:
- Timeframe: is your stop wide enough for the chart's normal noise?
- Upcoming news: economic releases can gap through stops — widen or avoid.
- Liquidity: thin markets (pre-market, overnight) fill worse.
- Spread: add the spread to your effective stop distance.
Worked examples: calculating stop distance, TP targets, and position size
The math is straightforward once you have a formula. Here's how to run it step by step.
Step 1: Define your risk per trade
Formula: Risk ($) = Account Balance × Risk %
Example: $10,000 account × 1% = $100 risk per trade
Step 2: Forex intraday example (EUR/USD, 15-minute chart)
- Entry: 1.0850
- ATR(14) on 15m = 12 pips → stop distance = 12 × 1.5 = 18 pips
- Stop-loss: 1.0832 (18 pips below entry)
- Take-profit at 1:2 R/R: 1.0850 + (18 × 2) = 1.0886 (36 pips above entry)
- Pip value for standard lot (EUR/USD): $10/pip
- Position size: $100 ÷ (18 pips × $10) = 0.56 lots (round to 0.5 lots)
Step 3: US stock example (AAPL, daily chart)
- Entry: $195.00
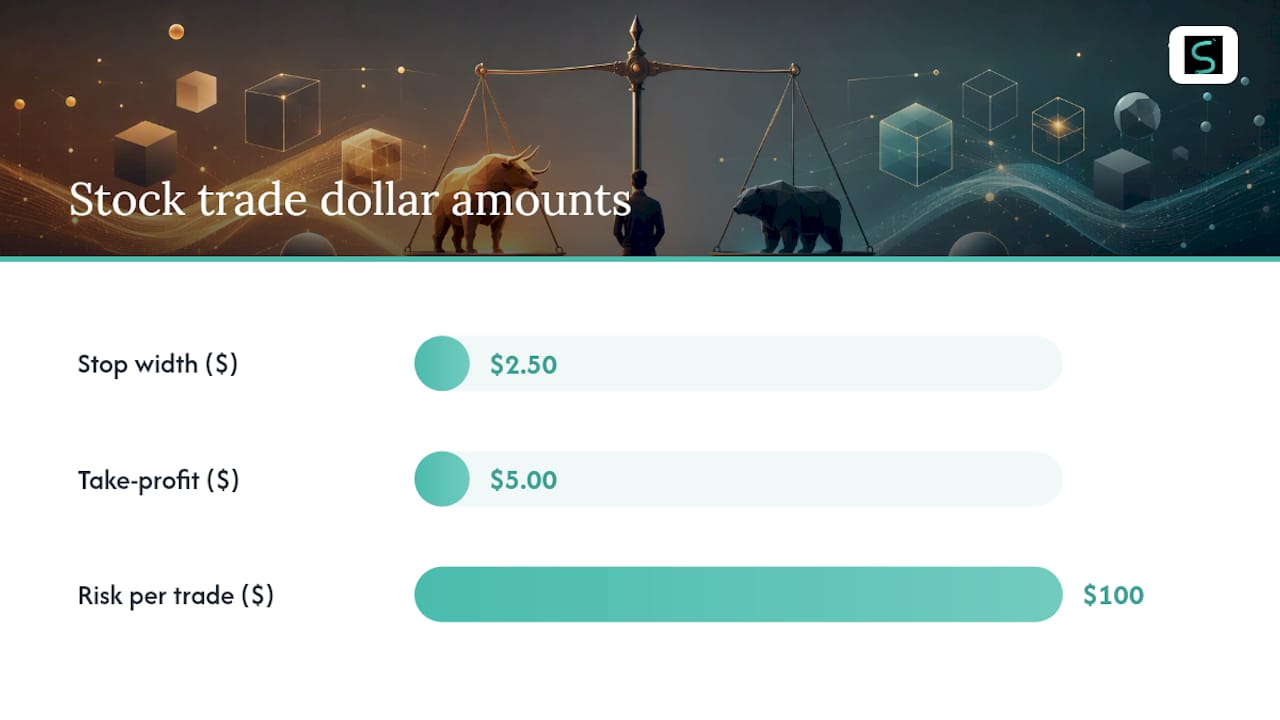
- Structural stop below recent swing low: $192.50 → stop distance = $2.50
- Take-profit at 1:2 R/R: $195.00 + (2 × $2.50) = $200.00
- Position size: $100 ÷ $2.50 = 40 shares
Notice how widening the stop from $2.50 to $5.00 (ATR-based) cuts position size to 20 shares — your dollar risk stays at $100, but you hold fewer shares. This is the core mechanic of position sizing for risk management: the stop width and position size always move in opposite directions to keep risk constant.
| Variable | Forex Example | Stock Example |
|---|---|---|
| Entry | 1.0850 | $195.00 |
| Stop-loss | 1.0832 (18 pips) | $192.50 ($2.50) |
| Take-profit | 1.0886 (36 pips) | $200.00 ($5.00) |
| R/R ratio | 1:2 | 1:2 |
| Risk per trade | $100 | $100 |
| Position size | 0.5 lots | 40 shares |
Platform note: minimum lot increments (0.01 lots in forex) and minimum share quantities mean your calculated size often rounds down. Always round down, never up — rounding up increases your actual risk above your target.
Common mistakes traders make with TP/SL and how to fix them
Most TP/SL errors aren't technical. They're behavioral. Here's what to watch for, and the process fix for each:
- Moving the stop away from price. Widening a stop after the trade goes against you converts a planned loss into a hope trade. This is the most dangerous stop-loss move you can make — only move stops toward profit, never away from it.
- Overleveraging. Taking a position so large that a normal stop triggers a loss you can't absorb emotionally. Fix: size to 1–2% risk per trade, always. See the trader risk management checklist for a full pre-trade protocol.
Psychology fix: taking partial profits at 1:1 R/R removes the emotional pressure to micromanage the rest of the trade. Once you've banked half the position and moved the stop to breakeven, the remaining position is essentially free. That mental shift — from "I might lose" to "I can only win or break even" — is what lets traders hold through normal pullbacks without panic-exiting.
For a full list of behavioral traps, the beginner trading mistakes guide covers 12 of the most costly errors with process-level fixes.
How to test whether your TP/SL rules actually work
Setting rules is step one. Knowing whether they work requires measurement. Track these metrics across a minimum sample of trades:
- Expectancy: (Win rate × Average win) − (Loss rate × Average loss). Positive expectancy means the rule is profitable over time.
- Win rate: what percentage of trades hit TP before SL.
- Average R multiple: average profit expressed as a multiple of the initial risk (1.0R = you made exactly what you risked).
- Max drawdown: the largest peak-to-trough loss in your test period — tells you if the rule is survivable psychologically and financially.
- Average hold time: how long trades typically stay open, which affects which timeframe your TP/SL settings belong on.
Mini-methodology:
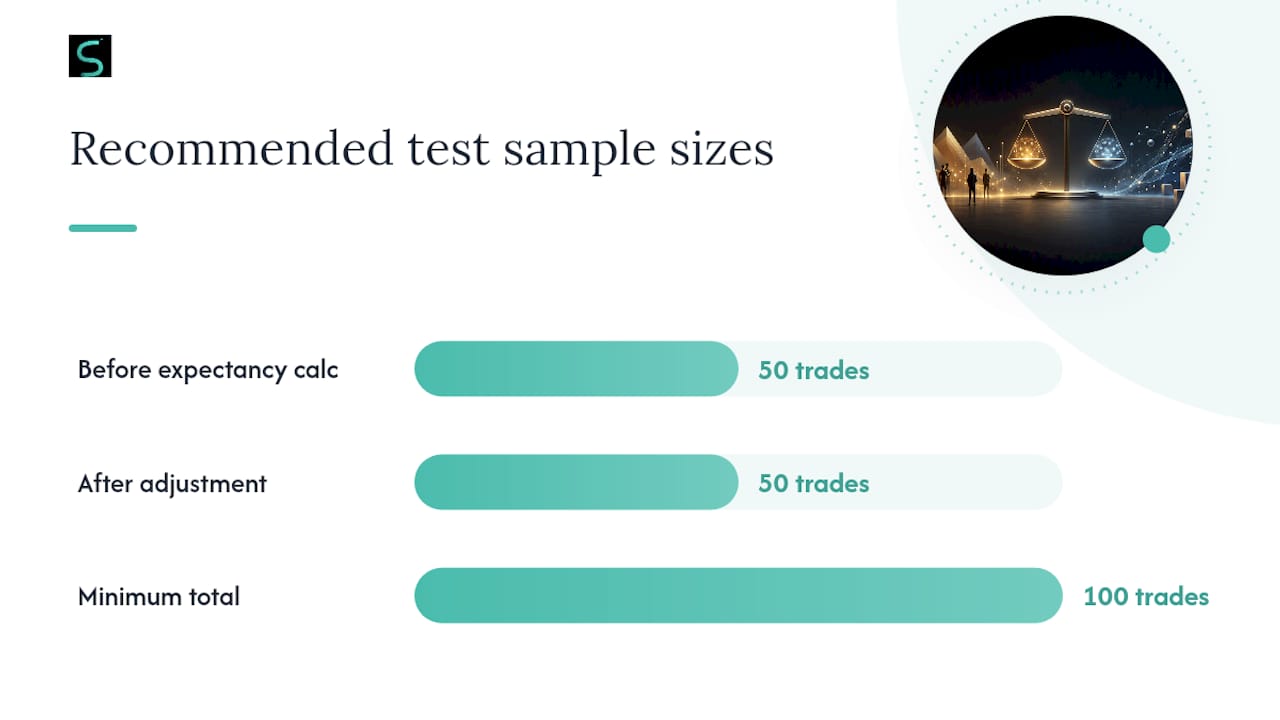
- Start with a demo account and forward-test your TP/SL rules for at least 50–100 trades before touching real capital.
- Log every trade: entry price, stop price, target price, spread at entry, slippage on exit, and outcome.
- After 50 trades, calculate expectancy. Then adjust one variable (SL width or R/R target) and run another 50 trades.
- Compare expectancy before and after the change. If it improves, keep the adjustment. If it drops, revert.
Pro Tip: Normalize your tests across assets using ATR as a percentage of price rather than raw pip or dollar amounts. A 20-pip stop on EUR/USD and a $2.50 stop on AAPL are meaningless to compare directly — but both expressed as a fraction of ATR give you a consistent volatility-adjusted metric. Use the automated trading checklist to standardize your logging format across instruments.
Key Takeaways
Setting stop-loss and take-profit levels before entry — sized to 1–2% account risk and a minimum 1:2 risk/reward ratio — is the single most reliable way to protect capital and build a profitable trading edge over time.
| Point | Details |
|---|---|
| Always set a stop-loss | No trade should go live without a defined exit for the losing scenario. |
| Size to 1–2% risk per trade | Calculate position size from your stop distance, not from a fixed lot or share count. |
| Target minimum 1:2 R/R | At 1:2, a 40% win rate is enough to be profitable — a realistic threshold for most strategies. |
| Use ATR to calibrate stops | ATR-based stops adapt to volatility and prevent normal market noise from triggering your exit. |
| Scalping-algo projects TP/SL | The indicator suite overlays exact TP and SL levels on your chart before entry, with backtesting to validate them. |
The part most traders skip — and why it costs them
Most retail traders spend hours finding entries and minutes on exits. That's the wrong ratio. The entry determines your direction; the stop-loss and take-profit determine your outcome.
Here's the view from working with short-term scalping setups: the traders who struggle most aren't the ones with bad entries. They're the ones who move their stops, skip their take-profits, or size positions without calculating risk first. The entry can be wrong 55% of the time and the account still grows — if the R/R is 1:2 and position sizing is consistent.
The ATR method deserves more credit than it gets. Fixed-pip stops are a crutch from an era when traders didn't have easy access to volatility data. ATR tells you what the market is actually doing right now, and your stop should reflect that. A 20-pip stop on a day when EUR/USD ATR is 40 pips is a near-certain loss. The same stop on a 12-pip ATR day is reasonable.
One more thing: backtesting your TP/SL rules isn't optional if you want to trade with confidence. Fifty trades on a demo account will tell you more about whether your levels work than any amount of reading. The traders who skip this step are the ones who abandon good rules after three consecutive losses because they have no data telling them the rule is sound over a larger sample.
Scalping-algo projects your TP and SL levels automatically
Calculating stop-loss and take-profit levels manually on every trade is where discipline breaks down under pressure. Scalping-algo removes that friction.

The premium TradingView indicator suite projects TP and SL levels directly on your chart at the point of signal generation — non-repainting, ATR-volatility gated, and calibrated for the 1m–15m timeframes where scalpers and intraday traders operate. You see the exact exit levels before you enter, not after. The backtesting dashboard logs signal outcomes with TP/SL results so you can measure expectancy on your specific instruments and refine levels with real data. Webhook alerts push to Discord the moment price approaches either exit, so you're never caught off-guard.
Membership plans cover crypto, forex, indices, commodities, and equities. To see how the 3-indicator system maps TP/SL projection to trade confluence, visit the product page and start with a plan that fits your trading schedule.
Useful sources and further reading
- Take-Profit Order (TP) — How to Maximize Profits in Trading
- Stop loss meaning — Forbes Advisor
- How to Set Stop Loss and Take Profit: Practical Guide 2026
- What Are Take-profit and Stop-loss Orders? How Do They Work? | IG International
- What are stop-loss & take-profit orders and how do you set them up? | Pepperstone
This article is general educational information, not financial or investment advice. Confirm current rules and suitability with a qualified financial professional before trading.