

Lower timeframes give you something higher timeframes simply cannot: precision. When you trade on the 1-minute to 15-minute charts, you see exactly where price is moving right now, not where it was yesterday. That granularity translates directly into tighter entries, tighter stops, and better risk-to-reward setups.
Here is the short answer to why retail and day traders focus on lower timeframes:
- Granular price data lets you pinpoint entries and exits with far more accuracy than a daily or weekly chart.
- Tighter stop-loss placement means you risk less per trade while targeting the same profit levels.
- Higher trade frequency suits scalping and day trading strategies built on quick, repeatable decisions.
- Execution timing on lower timeframes bridges the gap between a higher timeframe directional bias and an actual trade trigger.
- Psychological discipline is required, but traders who develop it gain a level of trade control that longer timeframes rarely offer.
- Tools like those from Scalping-algo are purpose-built for this environment, generating real-time, non-repainting signals on the 1m–15m range so retail traders can execute with institutional-grade precision.
Table of Contents
- Why lower timeframes work differently than higher ones
- How to choose the right timeframe for your trading style
- How multi-timeframe analysis actually works
- Common mistakes traders make on lower timeframes
- What research says about trading psychology on lower timeframes
- Risk management on lower timeframes
- How transaction costs eat into lower timeframe profits
- Key Takeaways
- Trade lower timeframes with tools built for it
Why lower timeframes work differently than higher ones
Scalpers and day traders operate on 1-minute to 1-hour charts. Position traders focus on daily to monthly charts. That gap is not just a preference difference — it reflects fundamentally different market environments.
- Lower timeframes (1m–15m): High volatility, frequent signals, more noise. Price moves fast and often reverses just as quickly.
- Higher timeframes (daily, weekly): Broader trends, institutional activity, cleaner structure. Moves are slower but more reliable.
- Trade frequency: Lower timeframes produce far more setups per session. More opportunities, but also more traps.
- Entry precision: Higher timeframes tell you the direction. Lower timeframes tell you the moment.
- Noise vs. signal: The 1-minute chart is full of false moves. The daily chart filters most of them out but sacrifices entry timing.
- The real edge: Combining both gives you the full picture. Neither alone is enough for consistent execution.
The key distinction is that lower timeframes are not better or worse than higher ones. They serve a different function. A daily chart tells you the trend is bullish. A 5-minute chart tells you when to actually pull the trigger.
How to choose the right timeframe for your trading style
Timeframe selection is personal. It depends on your patience, your schedule, and how you handle pressure.
- Scalpers and active day traders thrive on 1m–15m charts. Fast decisions, quick exits, high volume.
- Swing traders prefer the 4-hour or daily chart. They hold positions for days and do not need to watch every tick.
- Time availability matters. If you can only check charts twice a day, a 1-minute chart will destroy your results. Match your timeframe to your actual screen time.
- The 5-minute chart is a strong middle ground for most day traders. It filters out the worst noise of the 1-minute while still offering precise entry timing that the 15-minute cannot match.
- Consistency beats experimentation. Jumping between timeframes every week prevents you from learning what works. Commit to one combination for at least 30 trades before evaluating it.
- Noise tolerance is a real factor. If frequent stop-outs frustrate you, move up a timeframe. If slow markets bore you into bad trades, move down.
Pro Tip: Pick your execution timeframe first, then work backward to find the higher timeframe that gives it context. Most traders do it the wrong way around.
How multi-timeframe analysis actually works
Professional day traders assign roles to timeframes: the higher timeframe answers why you are trading, and the lower timeframe answers when you execute. That division of labor is the foundation of multi-timeframe analysis (MTA).
- Top-down approach: Start on the highest relevant timeframe. Get the directional bias first. Then drop down to find the setup.
- Three-timeframe structure: Traders typically use three distinct timeframes — one for trend, one for setups, one for entries. A common setup: daily for bias, 15-minute for structure, 5-minute for execution.
- Avoid redundancy: Using a 5-minute and a 3-minute chart together adds almost no new information. Choose timeframes that are clearly distinct from each other.
- Four or more timeframes cause confusion. Investopedia's research on MTA confirms that three distinct timeframes is the practical ceiling before contradictory signals start undermining decisions.
- Lower timeframe patterns are precise. A triple top on a 5-minute chart gives you a clear, objective entry trigger that a daily chart simply cannot offer.
- Holding time shrinks. Using a lower timeframe to time entries and exits reduces exposure to news events and overnight risk — a real structural advantage for retail traders.
Common mistakes traders make on lower timeframes
Lower timeframes punish sloppy habits fast. These are the errors that cost retail traders the most.
- Starting analysis on the lower timeframe. This creates confirmation bias. You find a signal on the 5-minute, then rationalize the daily chart to match it. Starting bottom-up is one of the most common strategic errors in retail trading.
- Ignoring higher timeframe context. Trading against the dominant trend because a lower timeframe signal looked clean is how accounts get ground down slowly.
- Overtrading on 1-minute charts. The signal frequency on ultra-low timeframes is relentless. Without strict rules, you will take setups that do not meet your criteria just because they appear.
- Trusting lower timeframe support and resistance. Higher timeframe SR zones represent institutional order blocks. Lower timeframe levels get broken constantly and often act as retail traps. Chasing 5-minute levels while ignoring the daily structure is a fast way to lose.
- Tight stops getting hit by noise. A stop that looks logical on a 1-minute chart often sits right inside the normal wick range of that candle. Price does not need to reverse to hit it.
- Ignoring emotional fatigue. Rapid-fire decisions across a full trading session deplete cognitive resources. Traders who do not account for this make progressively worse decisions as the session continues.
What research says about trading psychology on lower timeframes
The psychological demands of lower timeframe trading are not just anecdotal. The high signal frequency on 1-minute charts functions like a Variable Ratio Schedule of reinforcement — the same psychological mechanism behind slot machines — driving impulsive behavior and overtrading in retail traders.
Research insight: Overtrading on ultra-low timeframes triggers elevated cortisol responses, impairing decision quality and accelerating cognitive fatigue across a session.
The 5-minute chart is widely cited as the primary execution timeframe for active day traders precisely because it balances detail with psychological stability. It gives you enough granularity to time entries well without the constant noise that makes 1-minute trading so mentally taxing.
Professional traders also use a technique called artificial latency: they deliberately avoid watching the 1-minute chart until price reaches a key level. This approach inhibits the amygdala-driven impulsiveness that causes premature entries and exits, turning a stressful screen-watching session into disciplined, level-based execution. It works because it removes the trigger, not the trader.
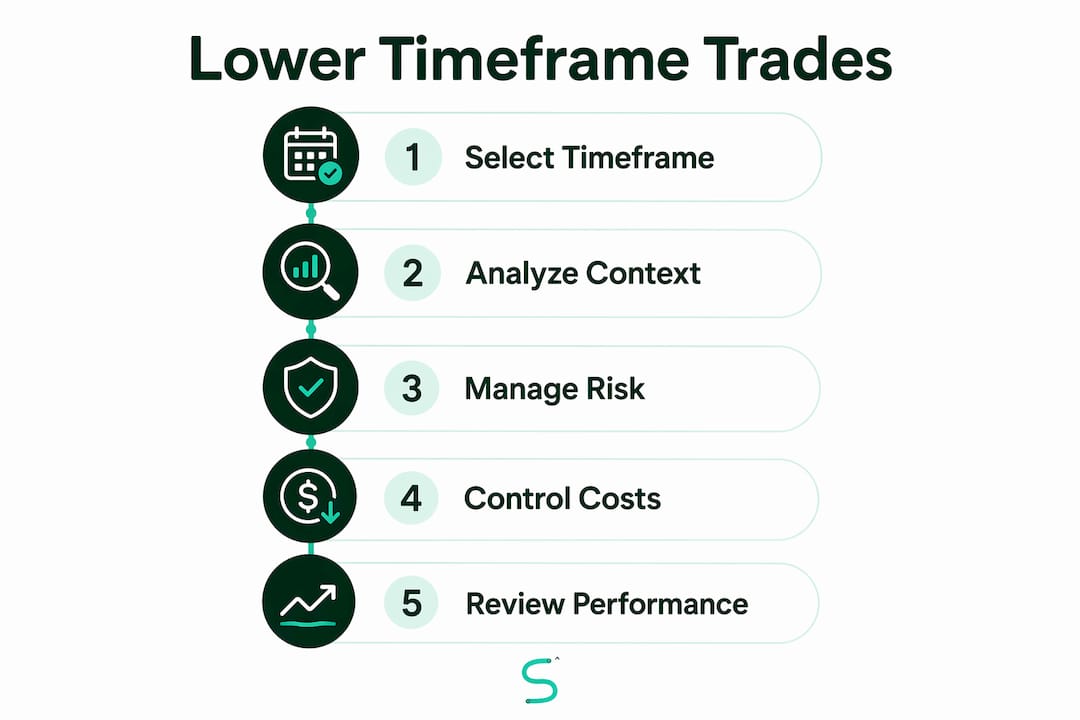
The top-down approach matters here too. Starting analysis on higher timeframes keeps you objective. You see the dominant structure before you see the lower timeframe signal, which means you are far less likely to rationalize a bad trade.
Risk management on lower timeframes
Lower timeframe trading compresses everything, including your margin for error. Risk management rules that work on a daily chart need to be tighter and more mechanical here.

Position sizing is non-negotiable. Because stop-losses are tighter on lower timeframes, position sizes can technically be larger for the same dollar risk. That math works in your favor — until noise hits your stop repeatedly. Keep position sizes consistent and do not scale up just because your stop looks tight.
Set a daily loss limit and honor it. Overtrading is the primary account killer on lower timeframes. A hard stop at 2–3 losing trades or a fixed dollar drawdown per session prevents one bad hour from becoming a catastrophic day.
Avoid trading around major news events. On a 1-minute or 5-minute chart, a CPI release or Fed announcement can move price 50–100 pips in seconds. Spreads widen, stops get hunted, and the normal structure of the chart becomes meaningless. Step aside. The lower timeframe trading tips that consistently work share one trait: they treat capital preservation as the first priority, not an afterthought.
How transaction costs eat into lower timeframe profits
This is where many retail traders underestimate the math. On a daily chart, a 2-pip spread on a forex pair is nearly invisible relative to a 100-pip target. On a 5-minute chart targeting 10–15 pips, that same spread represents a meaningful percentage of your expected gain before the trade even opens.

Spreads and commissions scale with trade frequency. A trader taking 20 positions per day pays 20x the transaction costs of a swing trader taking one. Over a month, those costs compound into a figure that can erase a profitable strategy's edge entirely.
Choose instruments with tight spreads. Major forex pairs like EUR/USD, equity index futures like the ES or NQ, and high-volume crypto pairs like BTC/USD tend to have the lowest spreads relative to their volatility. Illiquid instruments on lower timeframes are a cost trap. Pairing stock market indicators with tight-spread instruments gives you a real edge in managing total trade cost.
Factor costs into your backtesting. Any lower timeframe strategy that looks profitable without accounting for spreads and commissions is not actually profitable. Run your numbers with realistic cost assumptions before trading live.
Key Takeaways
Lower timeframes give retail traders precise entry and exit control, but only when combined with higher timeframe bias, strict risk rules, and disciplined psychological habits.
| Point | Details |
|---|---|
| Lower timeframes enable precision | 1m–15m charts provide granular data for tighter entries, exits, and stop placement. |
| Multi-timeframe structure matters | Use three distinct timeframes: one for trend, one for setups, one for entries. |
| Top-down analysis prevents bias | Always start on the higher timeframe to establish directional context before dropping down. |
| Transaction costs compound fast | Spreads and commissions multiply with trade frequency — always backtest with realistic cost assumptions. |
| Psychological discipline is required | Artificial latency and daily loss limits are practical tools to control impulsive lower timeframe behavior. |
Trade lower timeframes with tools built for it

Lower timeframe trading demands tools that keep up. Scalping-algo's premium TradingView indicators are built specifically for the 1m–15m range, generating real-time, non-repainting buy and sell signals with volatility gating and divergence detection. Whether you are scalping crypto, forex, or futures, the platform's Algo Master 3-indicator system gives you a structured, repeatable execution framework. Pair that with the Discord community for live sessions and mentorship, and you have the full setup for disciplined lower timeframe trading.