
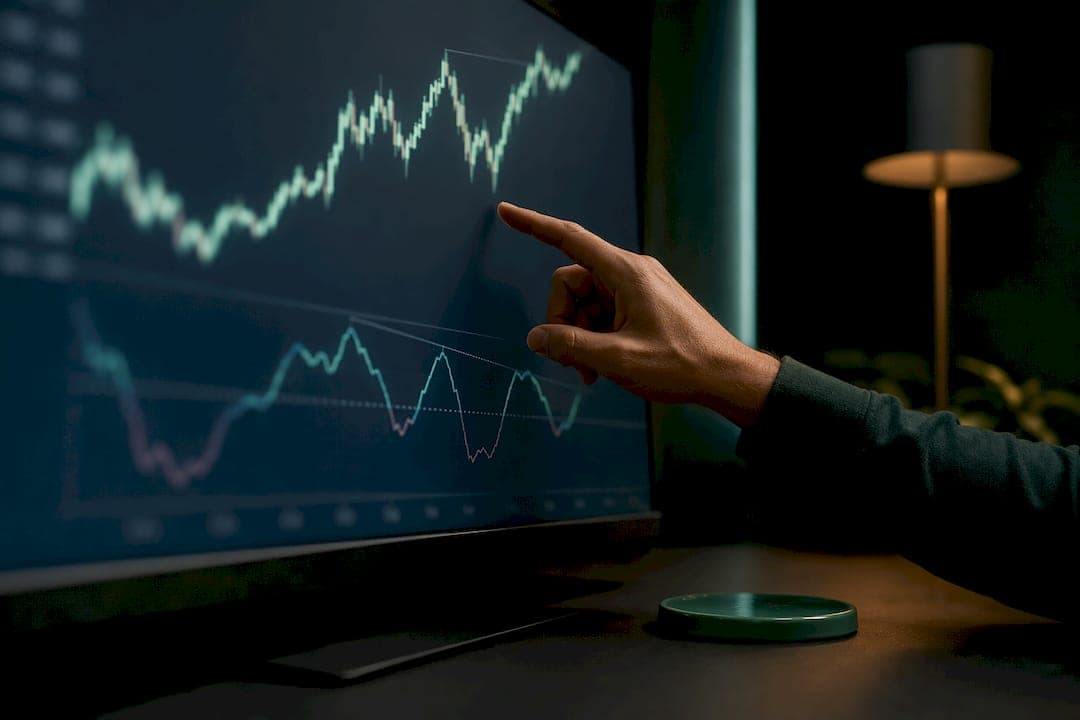
Use MACD divergence as a confirmation and early-warning signal, never as a lone entry trigger. Wait for a confirmed MACD crossover or a clear price-action reaction on candle close before you act, never relying on divergence alone. Filter by a higher-timeframe trend and backtest the exact rule-set you plan to trade, because divergence alone often produces too many whipsaws to trade blindly.
TL;DR:
- Use MACD divergence only as a warning signal, waiting for a confirmed crossover or price action reaction on candle close before trading.
- Apply divergence in conjunction with higher-timeframe trend filters and backtest thoroughly to avoid false signals and whipsaws.
- Focus on regular divergence for potential reversals and hidden divergence for trend continuation, but always confirm with clear signals before acting.
- Utilize a trend filter like a slower MACD and avoid divergence trades during sideways markets with low volatility or after numerous choppy sessions.
- Automate divergence detection and backtesting using tools like Scalping-algo to improve accuracy and reduce subjectivity in trading decisions.
Table of Contents
- What Is MACD Divergence and Why Does It Matter?
- Regular, Hidden, and Histogram Divergence: What's the Difference?
- How Do You Trade MACD Divergence With Confirmation Rules?
- Which Timeframes and Filters Reduce False Signals?
- How Do You Set Up and Backtest a Divergence Scan?
- Why Do MACD Divergence Signals Fail?
- A Scalper's View on Divergence and Confluence
- Detect Divergence Faster With Scalping-algo's Tools
- Sources
- FAQ
What Is MACD Divergence and Why Does It Matter?
MACD runs off three parts: the MACD line (the 12-period EMA minus the 26-period EMA), the signal line (a 9-period EMA of that MACD line), and the histogram, which plots the gap between the two. Those settings, 12, 26, 9, are the industry default and the ones most scanners and backrests use as a baseline.
Divergence shows up when price and the MACD line disagree. Price pushes to a new high or low, but the MACD line fails to confirm it with a matching extreme. That mismatch tells you momentum is fading even while price keeps grinding in the same direction.
Here's the part traders miss: divergence is a condition, not a countdown clock. It flags momentum exhaustion without telling you when the reversal actually starts. You can watch a divergence sit on a chart for ten bars before price ever turns. Treat it as a warning light on the dashboard, not a green light to fire.

Regular, Hidden, and Histogram Divergence: What's the Difference?
Regular (classic) bullish divergence occurs when price prints a lower low while MACD prints a higher low, suggesting weakening selling pressure. Regular bearish divergence is the opposite: price makes a higher high while MACD forms a lower high, indicating fading buying momentum. Both types often signal potential reversals and are commonly referenced by traders when discussing "MACD divergence."

Hidden divergence typically acts as a continuation signal rather than a reversal. Hidden bullish divergence arises when price makes a higher low but MACD forms a lower low, often during shallow pullbacks within uptrends. Traders employ this to align with ongoing trends rather than opposing them.
Histogram divergence measures the same momentum gap but visually, using the bars instead of the line. A shrinking histogram can hint at a crossover before it happens, though that compression also shows up in plain consolidation, so it needs the same confirmation discipline as line divergence.
How Do You Trade MACD Divergence With Confirmation Rules?
Spotting divergence is the easy part. Turning it into a trade with defined risk is where most retail traders lose the plot. Here's the checklist we'd run before clicking anything:
- Identify the divergence. Mark the two price extremes and the two matching MACD extremes. Confirm they actually diverge, not just look close on a compressed chart.
- Wait for the MACD line to cross the signal line, or wait for a clear price-action tell (a rejection wick, a break of a short-term trendline, a failed retest).
- Confirm on candle close. Never act on a crossover or price reaction that's still forming mid-bar.
- Enter after confirmation, not at the divergence itself. You'll give up some of the move, but you cut out most of the false signals.
- Place your stop beyond the recent structural swing, not at an arbitrary tick distance. For a bullish setup, that's below the most recent swing low.
- Size the position to risk a fixed percentage of your account, commonly 0.5% to 1% per trade, calculated from entry to stop.
- Scale out at logical resistance or support levels, and trail the remainder once price confirms the reversal with a break of structure.
Pro Tip: MACD is calculated intrabar, which means it can flash a crossover or a divergence that vanishes before the candle closes. Waiting for the close costs you a few ticks of entry price, but it filters out the repaint-style false signals that hit anyone trading mid-bar.
Which Timeframes and Filters Reduce False Signals?
Divergence on a 5-minute chart inside a strong daily trend is a different animal than the same pattern in a dead, rangebound market. The fix is a trend filter: run a second, slower MACD, something like 50, 200, 9, alongside your standard 12,26,9, and only act on divergence signals that agree with the slower MACD's position relative to zero.
Skip divergence trades when ADX is low or price has been chopping sideways for the last several sessions. MACD is a trend-following momentum oscillator at heart, and it whipsaws hard in indecisive ranges. If you're scalping faster instruments, tightening the MACD's smoothing periods can sharpen signals, but it also raises noise, so re-test the settings rather than assuming a faster market needs a faster indicator. Candle-close confirmation matters even more here, because compressed timeframes generate far more intrabar flicker.
How Do You Set Up and Backtest a Divergence Scan?
A workable chart setup pairs a standard MACD (12,26,9) with a slower trend MACD (50,200,9) and keeps the histogram visible for early momentum reads. From there, you can build scan logic that a screener or Pine Script alert can run for you instead of eyeballing every chart:
- Price prints a new swing low.
- The standard MACD prints a higher low at the same point.
- The histogram is shrinking or the MACD line is approaching a crossover.
- The slow trend MACD is above zero, keeping the setup aligned with the higher-timeframe bias.
Before you trust any of this with real size, run a structured backtest: pull at least 20 trades per instrument, or pool signals across a handful of correlated instruments if one alone doesn't give you enough sample size. Record win rate, profit factor, and average hold time, then run the same rule-set twice, once with the trend filter and once without, to see what it actually costs you in false signals versus what it costs you in missed trades.
Algorithmic detection has a real edge here over manual chart-watching: it applies the exact same criteria to every bar, every time, which strips out the subjectivity that creeps into visual pattern-spotting after your tenth chart of the session.
Why Do MACD Divergence Signals Fail?
Divergence fails most often in sideways markets, where price and MACD both chop without committing to a direction. You'll see a "divergence," take the trade, and get stopped out as price keeps ranging instead of reversing. That's a whipsaw, and it's the single most common way traders lose money on MACD signals.
The other failure mode is lag. Because MACD is built from moving averages, it reacts after price already moved, so a divergence can resolve into a shallow bounce instead of a real reversal. The mitigations are the same ones covered above: a trend filter, candle-close confirmation, defined stops, and a backtest that tells you honestly how often your specific rule-set actually works before you trade it live.
A Scalper's View on Divergence and Confluence
Divergence earns its place in a system only when it stacks with something else. We treat it as one vote among several: a non-repainting crossover confirmed on candle close, a momentum oscillator reading in agreement, volatility staying inside a tradeable range, maybe an order block nearby. One signal alone, divergence included, gets ignored more often than it gets traded.
That's really the whole argument for pairing momentum reads with structural context instead of trading any single oscillator in isolation. Run the backtest checklist above on your own instruments before you trust any of this with size.
— Tran
Detect Divergence Faster With Scalping-algo's Tools
Manually redrawing MACD swing points on five different timeframes for every ticker on your watchlist is where most divergence strategies quietly die from fatigue. Scalping-algo's Momentum Oscillator flags divergence and momentum shifts directly on the chart, non-repainting and confirmed on candle close, so you're reacting to a real signal instead of a mid-bar flicker.

The practical workflow: add the divergence scan to your chart, run it through the platform's backtesting dashboard to see win rate and profit factor before you risk anything, then turn on webhook alerts to Discord so confirmed signals reach you the moment they close, not five minutes later when you happen to check the chart. The Smart Scalping Signals suite layers in multi-timeframe confluence on top, which is the trend filter this article keeps circling back to, built in instead of bolted on. Plans run $79 per month, $799 per year, or a one-time $1,999 for lifetime access, and every script ships open-source so you can see exactly how the signal is calculated before you trust it.
Sources
The technical definitions and interpretation rules in this guide draw on IBKR Campus for MACD mechanics, Fidelity for whipsaw and confirmation guidance, Investopedia for standard parameters, and the CFA Digest on algorithmic pattern validation.
- Moving Average Convergence Divergence (MACD) — IBKR Campus
- MACD definition and usage — Investopedia
- Foundations of technical analysis and algorithmic pattern detection — CFA Digest (Lo et al.)
FAQ
What Is the Best Indicator for Spotting Divergence?
MACD and RSI are the two most widely used, and neither is strictly better; MACD reacts to the relationship between two EMAs, while RSI measures the speed of price change against a fixed scale. Stochastic works similarly to RSI but reacts faster in choppy conditions. Many traders run MACD alongside RSI or Stochastic for confluence rather than picking one.
What Is the Most Effective MACD Trading Strategy?
Combining crossovers with divergence and a higher-timeframe trend filter tends to outperform trading any single MACD signal alone, since MACD alone whipsaws in ranges. The most reliable approach confirms divergence with a candle-close crossover or price action rather than acting the moment the pattern appears.
Do Professional Traders Actually Use MACD?
Yes, MACD is a standard tool on institutional and retail trading desks alike, valued for its simplicity and clear crossover and divergence signals. Professionals rarely trade it alone, though; it's typically one input inside a broader confluence system with trend filters and defined risk rules.
Is MACD Divergence a Good Strategy on Its Own?
Divergence by itself is not a complete strategy; it's a warning sign that momentum is fading, best used to confirm or filter other signals rather than as a standalone trigger. Paired with a crossover confirmation, a trend filter, and a tested stop-loss rule, it becomes a genuinely useful piece of a larger system.
How Do I Backtest a MACD Divergence Strategy?
Record at least 20 trades per instrument, tracking win rate, profit factor, and average hold time, then compare results with and without a higher-timeframe trend filter. Tools like Scalping-algo's backtesting dashboard automate this tracking so you can validate a rule-set before risking capital on it.