

A whipsaw is a sharp price move in one direction that reverses quickly, often triggering stop-losses before price returns to where it started. Per Investopedia's canonical definition, the move traps traders on the wrong side and generates false signals that look legitimate in real time.
When you spot one forming, do these four things immediately:
- Reduce position size to your minimum unit until the move resolves.
- Avoid fresh directional entries until a candle closes beyond the contested level.
- Switch to limit orders rather than market orders to avoid chasing the spike.
- Wait for candle-close confirmation on at least a 15-minute chart before re-entering.
The sections below cover how to identify whipsaws on a chart, what causes them, how they hurt each trading style, and the step-by-step rules to manage or profit from them.
Key Takeaways
Whipsaws are survivable and even tradable when you apply size control and close-based confirmation before every entry.
| Point | Details |
|---|---|
| Definition and core risk | A whipsaw is a sharp price move that reverses quickly, triggering stop-losses before price recovers. |
| Top immediate action | Reduce position size and wait for a 15-minute candle close before entering or re-entering. |
| Stop placement rule | Use ATR(14) × 1.5–2.5 as your stop distance; avoid obvious round-number stop clusters. |
| Opportunity in whipsaw regimes | Mean-reversion scalps and defined-risk options structures can profit when rules and sizing are strict. |
| Scalping-algo advantage | Volatility gating and non-repainting signals on TradingView enforce the checklist automatically for active traders. |
Table of Contents
- What exactly is a whipsaw in trading?
- How to identify a whipsaw on your charts
- Real whipsaw examples you can map to your charts
- What causes whipsaws in the market?
- How whipsaws affect your trading style
- How to manage and avoid whipsaw losses
- Which indicators actually help you filter whipsaws?
- When a whipsaw regime is actually an opportunity
- A research-backed checklist for whipsaw-prone sessions
- A practitioner's perspective on living with whipsaws
- Scalping-algo cuts whipsaw hits with built-in volatility gating
- Sources
What exactly is a whipsaw in trading?
The term "whipsaw" comes from the two-person logging saw that cuts in both directions. In markets, it describes the same back-and-forth violence: price surges past a key level, stops get triggered, then price snaps back, leaving traders on both sides with losses.
Three distinct types show up repeatedly:
- Intraday stop-run whipsaw. Price breaks a round number or prior high, sweeps the stop cluster sitting just beyond it, then reverses within one to three candles.
- News-event gap/reversal. An earnings beat or macro surprise gaps price sharply, triggers momentum entries, then fades as the initial reaction is absorbed.
- Volatility-band oscillation. Price bounces between Bollinger Band or Keltner Channel extremes in a choppy, trendless session, generating repeated false breakouts.
The critical distinction between a whipsaw and a confirmed reversal comes down to four criteria:
- Speed: A whipsaw completes the fake move and reversal within a few candles. A confirmed reversal takes time to build structure.
- Wick length: Long upper or lower wicks relative to the candle body signal rejection, not acceptance.
- Failure to close beyond the level: The candle body never closes past the breakout point on a meaningful timeframe.
- Volume profile: The fake breakout spike shows high volume on the wick, but follow-through volume collapses immediately.
Pro Tip: When classifying a move, check the 15-minute close first. If the candle body closes back inside the prior range, treat it as a whipsaw candidate, not a breakout, regardless of how convincing the intrabar move looked.
How to identify a whipsaw on your charts
The fastest reliable filter is candle-close confirmation on a higher timeframe. An intrabar spike that looks like a breakout on a 1-minute chart often resolves as a wick on the 5-minute or 15-minute chart.
Price-based signals to watch:
- Long upper or lower wicks that exceed the candle body by 2× or more.
- Rejection candles (pin bars, shooting stars, hammers) at key support/resistance levels.
- Price failing to close beyond a breakout level on two consecutive candles.
Volume cues:
- A volume spike on the fake breakout candle with no follow-through on the next two to three candles.
- Volume divergence: price makes a new high or low but volume is lower than the prior swing.
Indicator behavior:
- ATR spikes sharply but RSI or MACD fails to confirm the momentum direction.
- Price tags VWAP, reverses, and closes back on the opposite side within the same session.
- Bollinger Bands widen briefly then contract, with price returning to the midline.
These signals rarely appear in isolation. The strongest whipsaw candidates show at least three of them simultaneously. For a deeper look at which volatility indicators give the clearest real-time reads, the full breakdown covers ATR, IV percentile, and VWAP in detail.
Pro Tip: Set your entries to trigger only on a 15-minute candle close, not on an intrabar touch. This single rule eliminates a large share of false breakout entries without requiring any additional indicator.
Real whipsaw examples you can map to your charts
These three scenarios repeat across asset classes. Annotate them on your own charts to build pattern recognition.
Example 1: Intraday stop-run at a round number. SPY is trading near $500.00. Price pushes to $500.15, triggering buy-stop orders clustered just above the round number. Volume spikes on the breakout candle. Within two candles, price reverses to $499.60. The 5-minute candle closes back below $500.00, confirming the stop-run. Traders who entered on the breakout candle are now underwater. The tell: the breakout candle had a long upper wick, and the next candle opened below the breakout level.

Within 30 minutes, the gap fills as institutional sellers distribute into retail buying. Stop-losses placed below the open are hit. The indicator signal: RSI was already above 75 at the open, MACD histogram was flat, and volume on the reversal candle exceeded the gap-up candle. Whipsaws around major news events like earnings are among the most common and costly.
Example 3: Premarket liquidity spike. During a thin overnight session in ES futures, price spikes 12 points above the prior day's high at 3:00 AM ET. Volume is a fraction of the regular session average. Price returns to the prior day's range within 20 minutes. Traders who placed buy-stops above the prior high are stopped out and then watch price recover. The low-liquidity environment amplified the move with minimal real participation.
Pro Tip: Screenshot and tag every whipsaw you encounter in a trade journal. After 20 tagged examples, the visual pattern becomes automatic. You will start seeing the wick-volume mismatch before the reversal completes.
What causes whipsaws in the market?
Four primary drivers create the conditions for whipsaws. Understanding them lets you anticipate the environment before it hits.
- High realized volatility. When ATR is elevated relative to its recent average, price moves are larger and faster, making stop clusters easier to sweep.
- Low liquidity. Thin order books, common in overnight sessions, premarket, and around holidays, allow small orders to move price disproportionately.
- Concentrated stop clusters. Retail traders tend to place stops at the same obvious levels (round numbers, prior highs/lows, moving averages). Algorithms and institutional desks know where these clusters sit.
- Algorithmic and HFT order flow. High-frequency traders can detect order imbalances and execute stop-hunting sequences faster than any manual trader can react.
Scheduled macro events compound all four factors simultaneously. CPI prints, FOMC decisions, and NFP releases create predictable volatility spikes where liquidity thins out in the minutes before the release, then floods back after. The result is a price spike in one direction followed by a rapid reversal as the initial reaction is digested.
Time-of-day matters too. The first 15 minutes after the U.S. equity open (9:30–9:45 AM ET) and the last 30 minutes before close (3:30–4:00 PM ET) carry the highest whipsaw frequency. Overnight and premarket sessions are structurally thin. Understanding institutional liquidity tactics and how they shape intraday price action gives you a real edge in reading these moves.
How whipsaws affect your trading style
The damage a whipsaw does depends entirely on your strategy. Here is how each style gets hit.
- Scalpers are the most exposed. Tight stops are the point of the strategy, and tight stops are exactly what stop-run whipsaws target. A 1% intraday reversal on a position using 10× leverage produces a 10% account drawdown on a single trade. The fix: use execution-grade tools, micro-size adjustments around key levels, and close-based entries. The stop-loss placement guide for scalpers covers the specific mechanics.
- Trend followers face a different problem. Whipsaws increase false-signal frequency, which means more losing trades in a row before the real trend resumes. Multi-timeframe confirmation (requiring the 1-hour and 4-hour charts to agree before entering on the 15-minute) is the standard filter.
- Swing traders can sometimes hold through a whipsaw if their stop is wide enough, but event risk and gap risk are real. Sizing for the possibility of a gap beyond your stop is not optional.
- Options traders face a two-sided problem. An IV spike before an event inflates premium, making long options expensive. After the event, IV crush can wipe out a long straddle even when price moved in the right direction. Options-based volatility strategies like iron condors and defined-risk strangles can hedge this exposure when sized correctly.
How to manage and avoid whipsaw losses
The single most effective control is not a better indicator. It is smaller size combined with confirmation before entry. Everything else is secondary.
Step-by-step rules:
- Pre-trade regime check. Before the session opens, check IV percentile (above 50th percentile signals elevated whipsaw risk) and ATR z-score (above 1.5 signals above-average range). If both are elevated, reduce your standard position size by 50%.
- Entry confirmation gate. Require two conditions to be true simultaneously: (a) the candle closes beyond the level on a 15-minute chart, and (b) volume on the breakout candle exceeds the 20-period average.
- Stop logic. Place stops using ATR × multiplier, not at fixed dollar amounts. On a 5-minute chart, ATR(14) × 1.5 is a starting point. Avoid placing stops at obvious round numbers or prior swing highs/lows where retail clusters concentrate.
- Avoid market orders in fast moves. Use stop-limit orders instead of stop-market orders to prevent slippage into a whipsaw spike.
- Time gates. Avoid new entries in the 10 minutes before and 15 minutes after a scheduled macro release. Close or reduce positions before earnings if you are not sized for gap risk.
- Exit rules. Use time gates (close the trade if it has not moved in your favor within X candles) alongside price gates (your ATR-based stop). Whichever triggers first wins.
Pro Tip: Place your stop beyond the next logical stop cluster, not at the obvious level. If the prior high is at $100.00 and you know retail stops sit at $100.05, place your stop at $100.15. You pay a slightly wider stop but avoid the sweep.
For a practical framework on monitoring volatility and adjusting positioning in real time, the full guide covers regime-based sizing in detail. For FX traders, hedging EURUSD volatility with defined-risk structures is one of the cleaner ways to reduce directional exposure during whipsaw-prone sessions.
Which indicators actually help you filter whipsaws?
Core indicators for whipsaw filtering, with suggested parameters by timeframe:
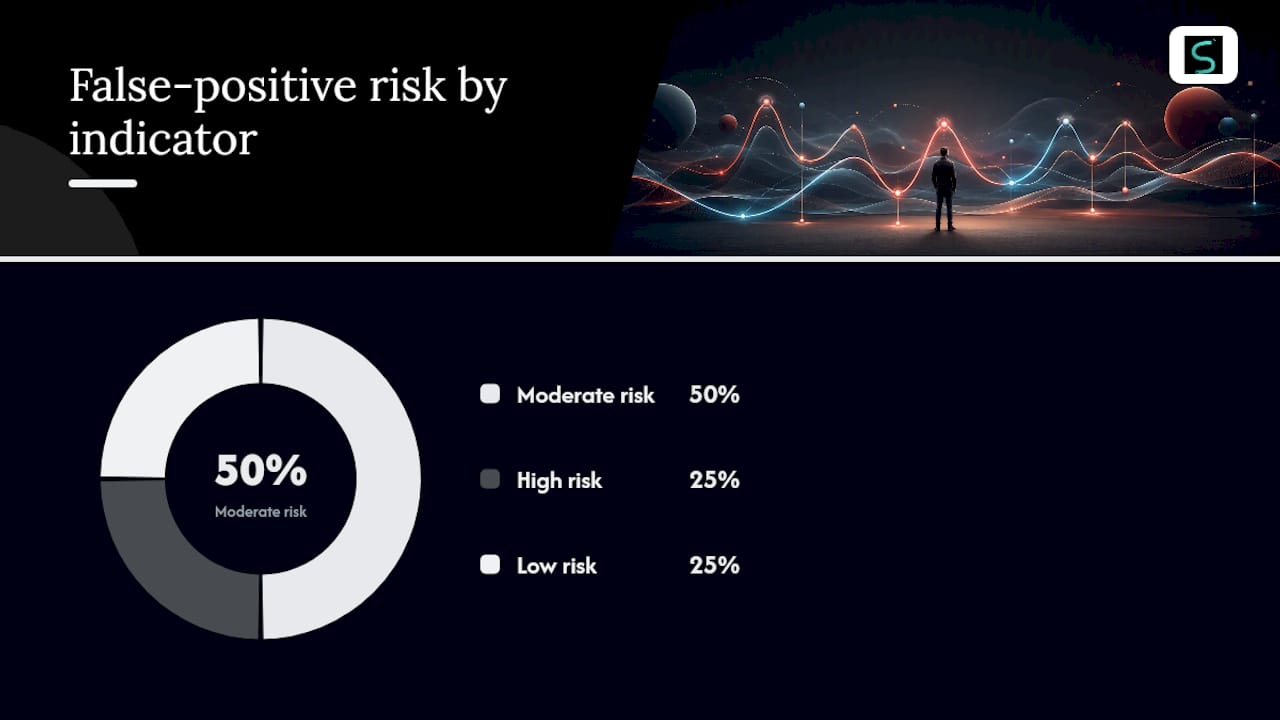
| Indicator | Why it helps | Suggested parameters | False-positive risk |
|---|---|---|---|
| ATR | Sets dynamic stop distance; flags elevated volatility | ATR(14), 1.5–3× multiplier on 5m charts | High if used alone without trend filter |
| VWAP | Volume-weighted price reference; rejection signals fake breakout | Session-anchored VWAP for intraday scalpers | Moderate; less useful on daily+ timeframes |
| 50 EMA | Trend filter; reduces counter-trend entries | 50 EMA on 1h+ charts | Low as a filter; high if used as entry signal |
| RSI | Momentum confirmation; divergence flags fake moves | RSI(14), divergence on 15m+ charts | Moderate; overbought/oversold alone is insufficient |
| IV Percentile | Flags elevated options premium and whipsaw risk | 30-day IV percentile; above 50 = elevated risk | Low as a regime filter |
| Volume | Confirms or denies breakout participation | 20-period volume MA; breakout needs 1.5× average | Moderate in low-float or thin markets |
One warning: repainting indicators are a serious problem in whipsaw detection. An indicator that recalculates past signals will look perfect in backtests and fail in live trading. Confirm that any indicator you use is non-repainting before trusting its signals. Overfitting parameters to a specific historical period is equally dangerous. Test any parameter set across at least two different market regimes before using it live.
When a whipsaw regime is actually an opportunity
Whipsaw-heavy markets are not purely a threat. For traders with the right setup, they are a tradable regime.
- Mean-reversion scalps within a confirmed range. When price oscillates between two defined levels with no trend, fading the extremes with tight stops and small size can be profitable. The key qualifier: the range must be confirmed on a 15-minute or higher timeframe, not just visible on a 1-minute chart.
- Long straddles or strangles before high-impact events. If you expect a large sustained move but are uncertain of direction, a long straddle (buying both a call and a put at the same strike) profits from a large move in either direction. The risk is IV crush if the move is smaller than the premium paid. Implied volatility drives option pricing, so buying premium when IV is already elevated is a common and costly mistake.
- Short-vol harvesting when VRP justifies it. When realized volatility is consistently below implied volatility, selling premium through iron condors or defined-risk strangles can capture the volatility risk premium. A dual-VIX signal strategy that combined expected VRP and VIX term-structure shape produced a 0.729 Sharpe ratio in a backtest from January 2016 through July 2026, illustrating that disciplined volatility timing can improve risk-adjusted returns. That said, selling volatility carries unlimited theoretical risk on naked positions. Use defined-risk structures and size conservatively.
The volatility trading advantages guide covers the full spectrum of approaches for traders who want to build a volatility-aware strategy rather than just defend against it.
A research-backed checklist for whipsaw-prone sessions
Use this checklist before every session where whipsaw risk is elevated.
Pre-session regime check:
- Check IV percentile. Above 50th percentile: reduce size. Above 75th percentile: consider non-directional or no new entries.
- Check ATR z-score. Above 1.5: widen stops by 1.5× your standard multiplier.
- Identify scheduled macro events (FOMC, CPI, NFP). Mark the 10-minute no-trade window before and 15-minute window after each release.
Entry rules:
- Require 15-minute candle close beyond the level (not intrabar touch).
- Confirm volume on the breakout candle exceeds the 20-period average by at least 1.5×.
- Check that RSI or MACD confirms the direction (no divergence).
Position sizing formula:
Risk per trade = (Account size × Risk %) ÷ (ATR × Multiplier × Contract value)
Max risk = $500. Position size = $500 ÷ ($0.50 × 2 × $50) = 10 contracts.
Stop logic:
- Set stop at ATR(14) × 1.5 minimum from entry. Extend to ATR × 2.5 around events.
- Avoid placing stops at round numbers or prior swing highs/lows.
Exit rules:
- Time gate: close the trade if no movement in your favor within 8 candles on your entry timeframe.
- Price gate: ATR-based stop triggers first, regardless of time.
The CFTC's investor education resources and the NFA's investor advisories provide authoritative guidance on margin, leverage, and counterparty risk in futures markets, all of which amplify whipsaw losses when not managed correctly. For VaR-based position sizing during high-volatility periods, the CorpHedge framework offers a structured approach to sizing decisions.
A practitioner's perspective on living with whipsaws
Experienced traders do not try to predict whipsaws. They build rules that make whipsaws survivable.
The shift in thinking usually happens after a painful loss, not a profitable trade. You get stopped out on a perfect-looking setup, watch price reverse to your target without you, and realize the problem was not your analysis. It was your stop placement and your size. The setup was fine. The execution was not sized for the environment.
What changes after that: you start checking ATR and IV percentile before every session, not after a loss. You stop placing stops at obvious levels. You reduce size before scheduled events rather than hoping the move goes your way. You add a time gate so a trade that goes nowhere gets closed, freeing capital for a better setup.
The behavioral shift matters more than any indicator. Process consistency, size control, and time-gating are the three habits that separate traders who survive whipsaw regimes from those who blow up in them. Scalable indicator suites that enforce volatility gating and non-repainting signals reduce the discretionary load, but they work only when the underlying rules are already sound.
Scalping-algo cuts whipsaw hits with built-in volatility gating
Whipsaw losses often come down to one gap: the rules are known, but execution in real time is too slow or too emotional. Scalping-algo closes that gap with a suite of premium TradingView indicators built specifically for short-term traders who need fast, reliable signals without the noise.

The platform's volatility gating automatically filters entries when ATR or IV conditions fall outside your defined parameters, so you are not chasing signals in environments where whipsaws are most likely. Non-repainting buy and sell signals on 1m–15m charts give you a clean read without historical distortion. Multi-timeframe confluence tools require agreement across timeframes before a signal fires, adding the confirmation layer that eliminates most false breakouts. The backtesting dashboard lets you validate your ATR multiplier and confirmation settings against real historical data before risking capital. Discord webhook alerts deliver signals directly to your phone so you never miss a close-based entry. Explore the full Algo Master system to see how these features map directly to the checklist above, then start your membership at Scalping-algo.com.
Sources
These sources back the claims in this guide and offer deeper study for traders who want to go further.
- Investopedia — Whipsaw definition and explanation
- MetroTrade — What Is Whipsaw Trading? (+ How to Manage It)
- CFTC digital assets and education pages
This article is general educational information, not financial or investment advice. Confirm current rules and risk parameters with a qualified professional or the relevant regulatory body before trading.
This article is general information, not a substitute for advice from a qualified financial advisor. Consult a qualified financial professional about your own circumstances before acting on anything here.