

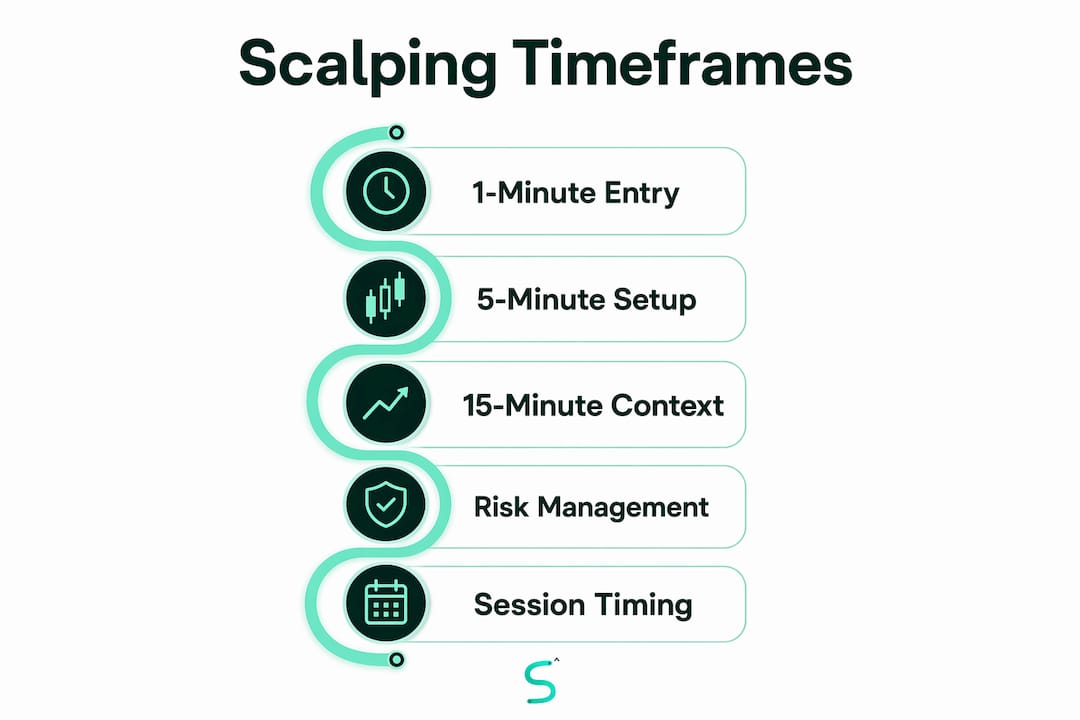
The optimal scalping timeframe structure is not a single chart. It is a three-layer system: a 15-minute or 30-minute chart for context and trend direction, a 5-minute chart for setup identification, and a 1-minute chart for precise entry timing. This multi-timeframe scalping approach filters noise, aligns entries with institutional order flow, and keeps risk tightly defined before you ever click buy.
Here is the core framework at a glance:
- Context chart (15M or 30M): Defines the session bias, key support and resistance, and whether price is trending or ranging
- Setup chart (5M): Identifies the actual trade structure, pullback, or breakout attempt with clear invalidation
- Entry chart (1M): Refines timing only after the 5M setup is already valid
- 3–5x multiplier rule: Your entry chart should be 3–5 times faster than your direction chart — a 1-minute entry chart pairs with a 5-minute direction chart
- Session priority: The London-New York overlap (8:00 AM–12:00 PM EST) delivers over 37% of daily forex volume and is the best window for tight, fast scalping
Single-timeframe scalping consistently underperforms. Without a higher-chart filter, you are trading noise as often as signal.
What is scalping and why does timeframe choice define your results?
Scalping is ultra-short-term trading. You target small price moves, hold positions for seconds to a few minutes, and repeat the process many times per session. Profit comes from volume of trades multiplied by a high win rate, which means every cost, every bad entry, and every false signal compounds fast.
Timeframe choice controls the quality of what you see. A chart that is too fast floods you with noise and false setups. A chart that is too slow misses the micro-structure you need to time entries and exits measured in seconds. Crypto scalping best practices use timeframes from 1 to 15 minutes; anything below one minute introduces excessive false signals due to erratic price behavior and slippage.

Scalping also carries a cognitive cost. Faster charts increase decision frequency, raise stress, and push traders toward overtrading. Managing that load starts with picking the right chart structure before the session opens. Tools like TradingView and Scalping-algo's Pine Script v6 indicators are built specifically for this environment, giving you real-time, non-repainting signals on the 1M–15M range without cluttering your screen.
Scalping differs from day trading and swing trading in one key way: holding time. Day traders hold for minutes to hours; swing traders hold for days. Scalpers are in and out in under five minutes, which makes timeframe selection the single most consequential pre-trade decision you make.

Detailed breakdown of the 1-minute, 5-minute, and 15-minute charts
Each chart plays a different role. Treating them as interchangeable is one of the fastest ways to blow a session.
| Timeframe | Best role | Pros | Cons | Experience level |
|---|---|---|---|---|
| 1-minute | Entry refinement | Precise timing, high signal frequency | Highest noise, spread-sensitive, emotionally demanding | Intermediate to advanced |
| 5-minute | Main setup chart | Balanced noise-to-signal, clear structure | Can still encourage overtrading without a higher filter | Beginner to advanced |
| 15-minute | Context and session bias | Clean price action, reliable structure | Too slow for entries; lags during news events | All levels |
The 1-minute chart is the classic execution frame. It shows every push, pullback, and rejection in real time. The problem is spread sensitivity: if your broker's spread consumes more than one-third of your planned move, the trade is mathematically unviable regardless of how clean the setup looks. Use the 1-minute only after the 5-minute setup is already confirmed.
The 5-minute chart is where most scalpers should spend the majority of their analysis time. It filters noise present in 1-minute charts while remaining sensitive enough to capture short-term momentum. A practical example: on EUR/USD during the London open, a 9-EMA crossing above the 21-EMA on the 5-minute, confirmed by a stochastic bounce from below 20, gives you a high-probability long setup before you ever drop to the 1-minute for the trigger.
The 15-minute chart sets the session bias. Before the London open, check whether price is consolidating at a prior high-volume node or breaking out of a range. A breakout on the 15-minute often leads to a run of clean scalps on the 1-minute and 5-minute below it. It is a context tool, not an entry tool.
- Sub-minute frames (10–30 seconds) significantly increase failure rate due to erratic price behavior
- Spread and slippage impact grows sharply as timeframe shrinks
- The 15-minute chart shows approximately 55–60% predictive accuracy for daily price direction in trending markets, but it is useless for actual entries
How to apply a multi-timeframe strategy step by step
Professional scalpers assign a distinct role to each chart: the highest for market structure, the middle for setup triggers, and the fastest for precise entries and stops. Trades taken without this confluence often result in losses because they fight institutional order flow rather than align with it.
Here is the decision flow:
- Start on the 15-minute. Mark the short-term trend, nearby support and resistance, and whether price is approaching a difficult zone. Note the 50-period EMA position.
- Drop to the 5-minute. Confirm the micro-trend direction. Is the market making higher highs and higher lows? Only scalp in that direction. Look for a pullback, range reaction, or breakout attempt with a clear invalidation level.
- Move to the 1-minute only for the trigger. Wait for a reversal candle, EMA crossover, or stochastic signal that confirms the 5-minute setup. If the 5-minute structure is unclear, more 1-minute candles will not fix it.
- Keep stop logic on the setup chart. Invalidation belongs to the 5-minute or 15-minute structure, not the latest small 1-minute candle.
- Check cost before entry. If the spread takes more than one-third of the planned move, skip the trade.
For indicators, a 20-period EMA on both the 1-minute and 5-minute charts gives you instant trend direction. Add a VWAP line to identify where liquidity clusters during the session. When price pulls back to touch VWAP after spiking above it, you have a clean entry window that aligns with EMA trend and session momentum. Keep the chart clean; avoid lagging oscillators like MACD on entry frames.
Pro Tip: Set price alerts on the 15-minute chart at your key levels. Do not stare at the 1-minute chart for hours waiting for a setup. Let the market come to your predefined zones, then execute.
How session timing shapes your timeframe decisions
The timeframe that works during the London-New York overlap behaves completely differently during the Asian session. Liquidity and spread conditions at varying session times require adaptive timeframe selection.
The London-New York overlap runs from 8:00 AM to 12:00 PM EST. It produces over 37% of daily forex volume, the tightest spreads on EUR/USD and GBP/USD, and the most directional price moves of the day. The 1-minute chart behaves predictably here. This is the primary window for tight scalping on 1-minute and 5-minute frames.
Session-by-session adjustments:
- London-New York overlap (8:00 AM–12:00 PM EST): Use 1-minute for entries, 5-minute for setup, 15-minute for context. Spreads tend to be tight; setups often are sharpest in this session.
- London open (3:00 AM–8:00 AM EST): High liquidity, often directional. Good for 5-minute setups with 15-minute context. Watch for volatility at the open.
- Asian session (7:00 PM–4:00 AM EST): Lower volatility, range-bound conditions. Shift to 5-minute or 10-minute as your entry frame. The 1-minute chart is often choppy with false signals.
- News releases (NFP, FOMC, CPI): Avoid the 1-minute chart entirely. Spreads can spike sharply in the 30-minute window around major releases. Either close positions before the release or skip the session.
- Dead zone (5:00 PM–7:00 PM EST): Extremely low liquidity, wide spreads. No scalping.
During extreme volatility, shift to longer timeframes. If you normally scalp 3-minute charts but volatility spikes, moving to 5-minute or 15-minute gives setups more room and reduces stop-outs from noise. Traders who avoid common investment timing mistakes know that chasing price in thin markets is one of the fastest ways to give back gains.
Beginner tips and the most common timeframe mistakes
Start with the 15-minute and 5-minute charts. Add the 1-minute only after you have written entry, exit, spread, and skip rules. Beginners should avoid the 1-minute chart until comfortable with the 5-minute setup, because shorter timeframes increase cognitive load and require sharper discipline to avoid errors.
Common mistakes to avoid:
- Using too many timeframes at once. Checking six charts before each trade creates paralysis by analysis. Stick to three: context, setup, entry.
- Dropping to the 1-minute when the 5-minute setup is unclear. More candles do not fix weak structure. If the setup is not there, it is not there.
- Ignoring spread before entry. If the spread exceeds one-third of your expected move, the timeframe does not matter. Skip the trade.
- Switching timeframes based on recent results. If the 5-minute stopped working yesterday, switching to the 3-minute today prevents your edge from manifesting. Evaluate over enough trades before changing anything.
- Scalping during news windows without a defined plan. Spreads widen sharply around high-impact releases. Either have a specific news-fade method with defined risk, or stay out.
- Treating the 1-minute chart as a rescue tool. Dropping to the 1-minute after missing a planned entry turns a missed trade into a forced one.
Faster charts increase decision frequency but raise stress and the risk of overtrading. Maintaining a manageable timeframe array directly reduces cognitive overload and keeps execution quality high across a full session.
Pro Tip: Build a written rule for entry invalidation tied to your setup timeframe. If the 5-minute candle closes below your invalidation level before you enter, the trade is off. No exceptions. This one rule eliminates most impulsive entries.
For practical scalping entry methods that map directly to each timeframe role, Scalping-algo's advanced setup guides walk through exact trigger conditions for both forex and crypto.
Final recommendations: choosing the best scalping timeframes
The 5-minute chart carries the main setup decision for most retail scalpers. The 15-minute chart stops you from scalping into poor structure. The 1-minute chart helps only when timing needs refinement and the setup is already valid.
Key takeaways for your trading routine:
- Always trade three charts: context, setup, entry. Never fewer, never more.
- Confirm session timing before opening any position. The London-New York overlap is your primary window.
- Check spread against expected move before every entry. If the math does not work, skip it.
- Keep stop logic on the setup chart, not the entry chart.
- Use TradingView's alert system to flag key 15-minute levels. Do not watch the 1-minute chart continuously.
- Scalping-algo's TradingView indicators generate real-time, non-repainting signals on the 1M–15M range, with built-in volatility gating and confluence tools that do the heavy lifting on timeframe alignment.
The best scalping timeframe structure is the one you can execute consistently, with written rules, across a full session without breaking the plan.
Risk management specific to scalping timeframes
Risk management in scalping is inseparable from timeframe choice. The faster the chart, the tighter the stop must be, and the more critical position sizing becomes.
The standard rule from multi-timeframe scalping practice: never risk more than 0.5% of account equity on a single trade. Calculate your stop-loss distance first from the setup chart, then size the position so the potential loss stays at that level. A 1-minute entry with a stop placed at a random small candle low instead of the 5-minute structure level will get hit by normal noise repeatedly, even on winning setups.
Stop placement belongs on the setup chart. If you entered on the 1-minute but your invalidation is a 5-minute candle close below support, that is where the stop goes. Tightening the stop to the 1-minute swing low to reduce dollar risk often just increases the frequency of being stopped out before the trade works.
Spread and slippage are fixed costs that scale with trade frequency. A scalper taking 20 trades per session on EUR/USD with a 0.8-pip spread pays far more in total cost than one taking 10 trades with a 0.1-pip spread. Timeframe selection directly controls trade frequency, which means it directly controls your total cost burden per session.
Finally, set a hard daily stop. Scalping's high frequency means a bad session can compound losses fast. Decide the maximum daily loss before the session opens, and stop trading the moment you hit it. This rule matters more on faster timeframes, where the temptation to "trade back" losses is strongest.
Key Takeaways
The most effective scalping timeframe structure combines a 15-minute context chart, a 5-minute setup chart, and a 1-minute entry chart, always filtered by session timing and spread checks.
| Point | Details |
|---|---|
| Use three chart roles | Assign context (15M), setup (5M), and entry (1M) roles — never trade off a single timeframe. |
| Apply the 3–5x multiplier | Your entry chart should be 3–5 times faster than your direction chart to avoid micro-pullback traps. |
| Prioritize the London-New York overlap | This four-hour window produces over 37% of daily forex volume with the tightest spreads and sharpest setups. |
| Check spread before every entry | If spread exceeds one-third of the expected move, skip the trade regardless of setup quality. |
| Keep stops on the setup chart | Stop logic belongs to the 5-minute or 15-minute structure, not the latest 1-minute candle. |
Ready to put this framework into practice? Scalping-algo's premium TradingView indicators are built specifically for the 1M–15M range, with real-time signals, volatility gating, and multi-timeframe confluence tools designed for retail forex and crypto traders.
