

Trading expectancy = (Win rate × Average win) − (Loss rate × Average loss). A positive number tells you how much profit you can expect per trade on average; a negative number tells you how much you're losing on average, no matter how good individual trades feel. Expectancy is a long-run average, not a prediction for your next trade, and the inputs need to match: net figures with net figures, gross with gross, and loss rate always equals 1 minus win rate.
TL;DR:
- Use at least 50 to 100 closed trades before trusting expectancy, then track a rolling 50 or 100 trade window to spot deterioration early.
- Compare setups or account sizes with R expectancy, and normalize variable position sizes so unusually large trades do not distort dollar averages.
- Subtract commissions, spreads, financing costs, and estimated slippage from every trade; mixing net and gross figures can turn apparent profits into breakeven results.
- Pause or reduce risk if rolling expectancy stays negative, and investigate changes in market conditions, execution quality, or strategy rules before retesting.
Table of Contents
- 1. Breaking down the inputs with a worked example
- 2. What counts as good expectancy and how it relates to other metrics
- 3. Step-by-step workflow to calculate expectancy from your trade history
- 4. Practical adjustments and pitfalls that distort real-world results
- 5. Using expectancy in practice: sample size, monitoring, and decision rules
- 6. Scalping-Algo: how we measure win rate and apply expectancy
- 7. Three takeaways from applying expectancy to scalping
- Tools that help you measure and protect expectancy
- FAQ
- Sources
1. Breaking down the inputs with a worked example
Win rate is the percentage of trades that close profitable. Loss rate is simply 1 minus win rate, since every closed trade is either a win, a loss, or a breakeven we count as zero. Average win is the mean dollar (or point) gain across winning trades; average loss is the mean dollar loss across losing trades, expressed as a positive number for the formula to work cleanly. R-multiples normalize every trade to a multiple of your initial risk, so a trade that gains twice what you risked is "+2R" regardless of account size.
Here's a dollar example:
- You take 100 trades. 40 win, 60 lose.
- Win rate = 0.40, loss rate = 0.60.
- Average win = $150. Average loss = $80.
- Expectancy = (0.40 × $150) − (0.60 × $80) = $60 − $48 = $12 per trade.
Now in R-multiples, assuming each trade risks 1R: if your average winner returns 1.9R and your average loser costs 1R, the math becomes (0.40 × 1.9R) − (0.60 × 1R) = 0.76R − 0.60R = 0.16R per trade. That number travels with you across account sizes. A $5,000 account and a $50,000 account both have the same 0.16R edge; only the dollar amount per trade changes with position size. Round consistently, and treat scratch or breakeven trades as zero rather than dropping them, since excluding them inflates both your win rate and your average win.
2. What counts as good expectancy and how it relates to other metrics
Your breakeven win rate, the minimum win percentage needed just to avoid losing money, follows a simple pattern: breakeven win rate = 1 / (1 + reward-to-risk ratio).
- At 1:1 R:R, you need roughly a 50% win rate to break even.
- At 2:1 R:R, roughly 33% keeps you at breakeven.
- At 3:1 R:R, roughly 25% is enough to break even.
This is why a trader who wins only 35% of the time can still run a profitable system, provided winners are large enough relative to losers, while a trader winning 65% of the time can bleed out slowly if losses run bigger than wins.
A system with positive dollar expectancy but a small sample size can still produce a losing month, since expectancy describes the long-run average, not short-term variance.
Profit factor (gross profit divided by gross loss) and R-expectancy both describe edge, but they answer slightly different questions. Profit factor tells you the ratio of money made to money lost; R-expectancy tells you what each unit of risk returns on average, which makes it the better tool for comparing setups with different stop distances. As a rough and non-prescriptive example, many systematic traders consider 0.2R to 0.5R per trade a workable range for active strategies, though the number that matters is whether it holds up over a meaningful sample.

3. Step-by-step workflow to calculate expectancy from your trade history
Expectancy is only as good as the data behind it, so the process matters as much as the formula.
- Export your closed trades from your broker or journal, including entry, exit, size, and fees if available.
- Decide upfront whether you're using net figures (after commissions and fees) or gross figures, and stick with that choice for every trade.
- Separate winners from losers, then count each group and calculate win rate, average win, and average loss.
- Decide your unit: dollars for a single account, R-multiples when you want to compare setups or account sizes.
- Normalize position sizes if they varied, so one oversized trade doesn't skew your average win or loss.
- Record costs consistently: commissions, spreads, and any financing or borrowing costs on leveraged positions, per FINRA guidance on fees and commissions, which reduce per-trade returns and need to come out before you call a number "expectancy."
- If slippage isn't logged directly, estimate it by comparing your intended entry or exit price against the actual fill price on a sample of trades, then apply that average gap going forward.
Pro Tip: Keep a separate column for "intended exit" versus "actual exit" in your journal: the gap between them is your real-world slippage, and it's often bigger than traders assume.
Consistency here is what separates a useful expectancy figure from a misleading one. Mixing net and gross trades, or forgetting a batch of commissions, can flip a strategy from mildly profitable to breakeven without you noticing.
4. Practical adjustments and pitfalls that distort real-world results
A calculated expectancy on a spreadsheet and a realized expectancy on your statement are rarely identical, and the gap usually comes from a handful of predictable sources.
- Price slippage, partial fills, and execution venue routing can change your realized entry and exit prices, and the SEC's guidance on trade execution explains how order routing and timing create price improvement opportunities or added costs that affect your outcome.
- Commissions, spreads, and financing costs should be subtracted from every trade before averaging; skipping this step on a scalping strategy with many small trades can turn a positive number negative fast.
- Variable position sizing across trades distorts a simple dollar average, so convert to R-expectancy or use a size-weighted average when risk per trade changes.
- Survivorship bias and cherry-picked samples inflate expectancy estimates; test on a full, unedited trade log rather than a curated highlight reel, and avoid tuning a strategy on the same data you're using to measure it.
Reducing execution drag is largely a matter of process. Our guide to cutting slippage with execution-first levers walks through specific adjustments that narrow the gap between theoretical and realized expectancy.
5. Using expectancy in practice: sample size, monitoring, and decision rules
A single trade tells you nothing about edge; expectancy needs enough trades to separate signal from noise. A commonly cited guideline calls for at least 50 to 100 trades before trusting an expectancy number, since smaller samples carry too much random variance to reflect the true edge of a strategy.
- Use R-expectancy, not dollar expectancy, when comparing two setups or two account sizes side by side.
- Recalculate expectancy on a rolling window (the last 50 or 100 trades) to catch strategy decay before it does serious damage.
- Pause or cut risk when rolling expectancy turns negative for a sustained stretch rather than waiting for a full losing month to confirm it.
- Re-backtest or iterate on a strategy only after isolating what changed, market conditions, execution quality, or the rules themselves.
Out-of-sample testing is one of the more reliable ways traders catch an overfit strategy before risking live capital on it, which is why a disciplined backtesting process matters as much as the expectancy formula itself. Treating expectancy as a decision input rather than a report card, something you check before sizing up, not just after a bad week, keeps the metric useful instead of reactive. For traders who like formalizing this kind of check, a structured approach to tracking expected value in decision logs applies the same logic outside of markets.
6. Scalping-Algo: how we measure win rate and apply expectancy
We built our performance methodology around the same principle this article argues for: inputs have to be consistent and verifiable before a number means anything. Our signals are non-repainting and confirmed on candle close, so a win or loss logged in our Command Center reflects what a trader actually could have taken, not a repainted result after the fact. Standardized stop placement across our indicator suite keeps average win and average loss comparable trade to trade, instead of varying with manual discretion. Backtesting results and live webhook alerts feed into the same dashboard, which closes the loop between a strategy's theoretical expectancy and what it produces in real market conditions.

7. Three takeaways from applying expectancy to scalping
Three things stand out after running expectancy math across short-term setups. First, prefer R-multiples over dollar figures whenever you're comparing strategies or scaling size, since R travels cleanly across account changes. Second, execution quality can make or break a scalping edge faster than almost any other factor, our risk-reward templates are built around that reality. Third, monitor rolling expectancy, not lifetime averages, because decay shows up there first.
— Tran
Tools that help you measure and protect expectancy
Clean expectancy math depends on consistent signals and consistent execution, which is exactly what our indicator suite is built to support. Edge Finder helps you identify and backtest setups so you can compare expectancy across strategies before risking capital. Smart Scalping Signals delivers non-repainting entries on lower timeframes, which keeps your average win and average loss data honest instead of skewed by repainted hindsight. Our Command Center dashboard logs every alert and backtest result in one place, so your trade history stays exportable and auditable.
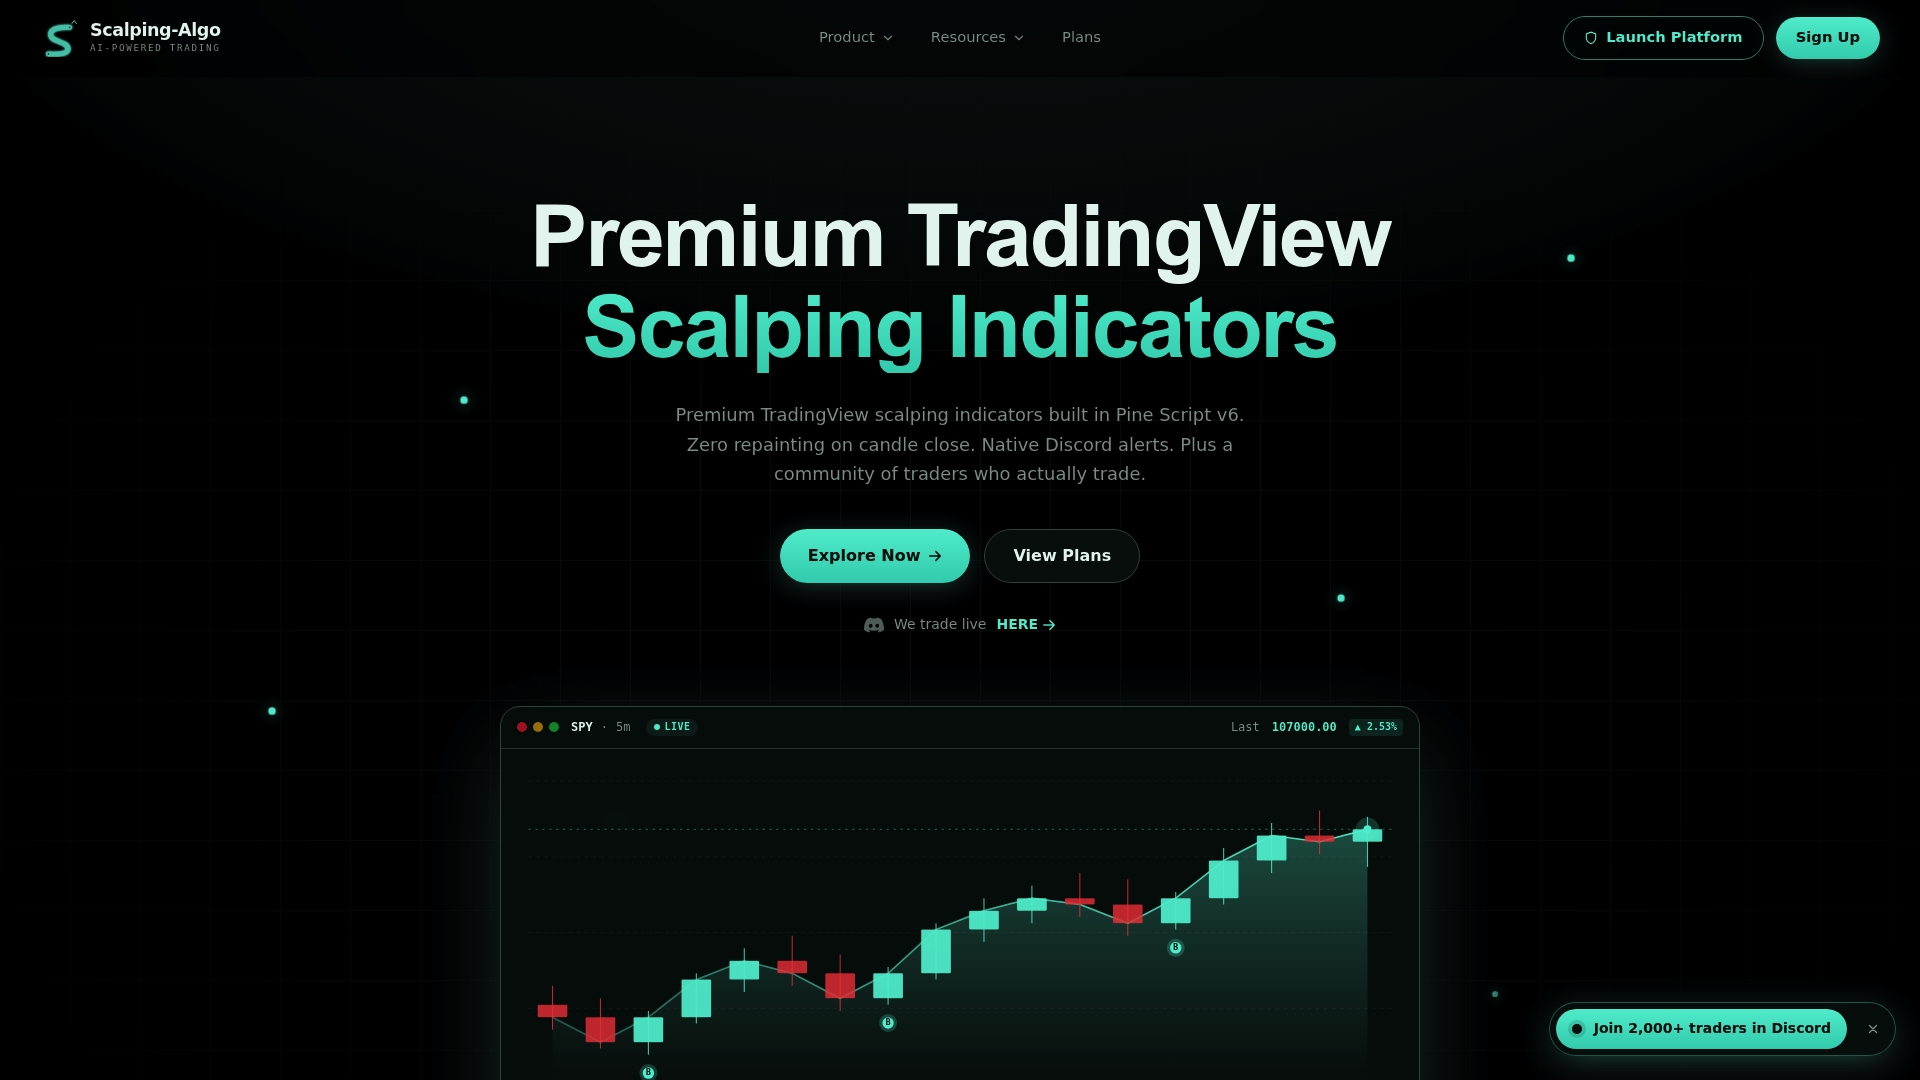
- Edge Finder: backtest and compare setups before committing size.
- Smart Scalping Signals: non-repainting entries for cleaner win/loss data.
- Command Center: logs trades for a reproducible expectancy calculation.
Explore our plans, with monthly, annual, or one-time lifetime access pricing, and start building expectancy numbers you can actually trust.
FAQ
What is the expectancy formula?
Trading expectancy equals (win rate × average win) minus (loss rate × average loss), giving you the average profit or loss per trade. A positive result means the strategy pays off on average over time; a negative result means it loses money on average, regardless of how any single trade turns out.
What is the 3-5-7 rule in trading?
This refers to a risk management guideline some traders use for position sizing and diversification, but definitions vary and it isn't tied to a single authoritative source. It's not part of the expectancy calculation itself, which relies only on win rate, average win, and average loss.
Is it possible to make $10,000 a month day trading?
Outcomes vary widely based on account size, strategy, and execution quality, and no fixed income figure applies universally to day trading. What determines results over time is a strategy's expectancy combined with sufficient sample size and sound risk management, not a specific monthly target.
What is the 3 6 9 rule in trading?
Like the 3-5-7 rule, this is an informal guideline some traders reference for structuring trade size or risk, without a single standard definition. It isn't part of the core expectancy formula, which depends on win rate and the average size of wins versus losses.
How many trades do I need before trusting my expectancy number?
A commonly cited guideline calls for at least 50 to 100 trades before treating an expectancy calculation as reliable, since smaller samples carry too much random variance. Recalculating on a rolling window after that point helps you catch changes in a strategy's real edge.
Sources
- SEC - Where to Find Information on Best Execution and Trade Execution Risks
- FINRA - Fees and commissions