

Before your first demo session, lock in these micro-rules:
- Timeframes: 15M for bias, 5M for structure, 1M for entry timing
- Spread guard: only trade when the live XAU/USD spread is below $0.25 (2.5 pips); wider spreads kill the edge
- Risk cap: 1% of account per trade, 2% maximum daily loss
- Session filter: London open (3:00–5:00 AM ET) or London–New York overlap (8:00–11:00 AM ET) only
- News block: no entries within 15 minutes before or after any high-impact US data release
Pro Tip: The single most common first-session error is entering on the breakout candle itself. Wait for the close back inside the range. One candle of patience separates a high-probability entry from an algorithmic trap.
Key Takeaways
| Point | Details |
|---|---|
| Macro filter comes first | Check DXY and real yields before the chart; trade with macro, not against it. |
| Session selection matters | Trade London open (3–5 AM ET) and London–New York overlap (8–11 AM ET) only. |
| Spread is a hard gate | Live XAU/USD spread above $0.25 is a no-trade condition, no exceptions. |
| Structural stops, not fixed pips | Place stops beyond the sweep wick; use ATR(14) to confirm the stop is outside normal noise. |
| 1% risk, 2% daily max | Size every trade to 1% of account; stop the session after hitting 2% daily loss or 3 consecutive losses. |
| Scalping-algo accelerates execution | The Algo Master suite provides FVG detection, non-repainting signals, and a backtesting dashboard for this exact workflow. |
Table of Contents
- Why does gold behave differently intraday, and when does scalping make sense?
- What chart setup and indicators do you actually need?
- What does the full pre-trade workflow look like?
- What are the exact entry rules for a liquidity-sweep setup?
- How do you set stops, take profits, and manage the trade?
- How do you size positions and protect the account?
- When are the best times to scalp gold, and what should you avoid?
- How do you backtest this setup and know if you have a real edge?
- What mistakes do gold scalpers make most often?
- Why the macro-first, liquidity-sweep approach is our preferred edge
- Scalping-algo gives you the signals and automation to run this faster
- Sources
Why does gold behave differently intraday, and when does scalping make sense?
Gold's long-run floor comes from central bank buying and physical demand, but those forces are irrelevant on a 5-minute chart. Intraday price action is driven almost entirely by the US dollar (DXY), real yields, and risk sentiment. When DXY rises and real yields push higher, gold faces headwinds regardless of what the 1-minute chart looks like.
The practical order of operations, as KenMacro's desk framework describes it: read the dollar first, real yields second, and only then use the chart for entry selection. Skipping that sequence is the primary reason retail scalpers take trades against the macro flow and wonder why their technically clean setups fail.
When scalping XAU/USD makes sense:
- DXY is trending or consolidating with a clear directional lean
- Real yields are stable or moving in a direction consistent with your bias (falling yields favor longs)
- Price is in a defined session range with clear swing highs and lows to sweep
- Spread is below $0.25 and the session has adequate liquidity
When to stay out:
- FOMC statements, CPI, NFP, or any Tier-1 US data within 15 minutes
- Panic spikes or gap opens with no clear structure
- Asian session low-liquidity hours (spreads widen, moves are thin and choppy)
- DXY and gold moving in the same direction simultaneously (unusual correlation breakdown)
Pro Tip: Check the 10-year TIPS yield on TradingView alongside DXY before each session. If both are spiking, gold longs are low-probability regardless of what the 5-minute chart shows. That one check eliminates a category of losing trades before you even open a position.
For a deeper look at gold's macro drivers and dollar dynamics, the relationship between DXY and XAU/USD is worth studying beyond the intraday context.
What chart setup and indicators do you actually need?
Keep the setup lean. More indicators do not mean more edge; they mean more conflicting signals.
Timeframe stack
Use a multi-timeframe approach with three charts open simultaneously:
- 15M: directional bias using the 50 EMA; price above = favor longs, below = favor shorts
- 5M: structure identification, EMA 9/21 crossover zone, VWAP as session reference
- 1M: entry timing, FVG identification, sweep confirmation
Indicator set
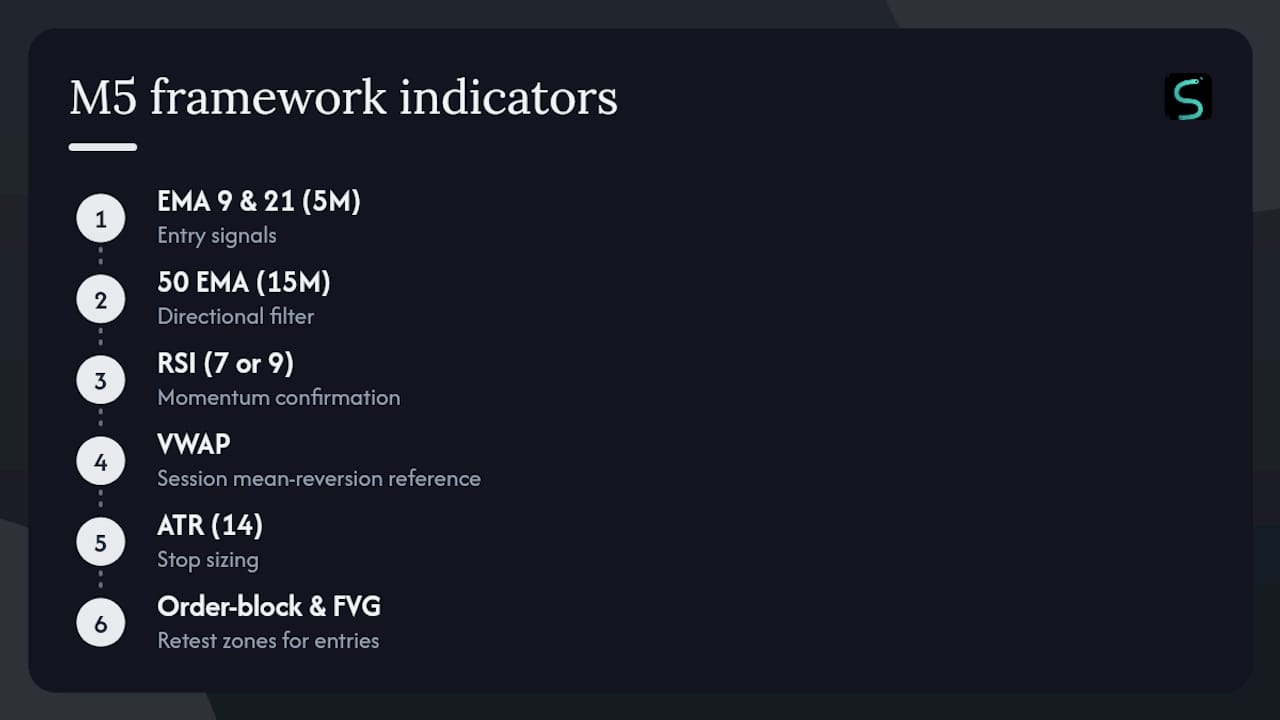
The M5 framework from GoldTraderMo provides a tested starting point: EMA 9 and 21 on the 5M for entry signals, the 50 EMA on the 15M as the directional filter, RSI (7 or 9 period) for momentum confirmation, VWAP as a session mean-reversion reference, and ATR(14) for stop sizing. Add order-block and fair value gap (FVG) detection to identify the retest zones where entries trigger.
On TradingView, all of these are available natively or through community scripts. The top TradingView indicator configurations for scalping walk through the exact settings worth using on 1M and 5M charts.
Execution requirements
- Broker: ECN or STP account with raw spreads; target sub-$0.25 gold spreads. Spreads above $0.25–$0.30 materially erode scalping profitability on XAU/USD
- Order entry: one-click trading enabled or hotkey orders; manual order-entry menus cost seconds that matter on 1M charts
- Latency: under 50ms to broker server; a VPS near your broker's data center is worth the cost if you automate alerts
- Spread monitor: keep a live spread widget visible at all times
Pro Tip: Set TradingView alerts on your EMA crossover and VWAP levels before the session opens. Watching for the signal manually while managing an open trade splits attention at exactly the wrong moment.
What does the full pre-trade workflow look like?
Run this sequence before every session, in order. Skipping steps is where discipline breaks down.
Step-by-step sequence
- Macro check (5 minutes before session): Open DXY and the 10-year TIPS yield. Determine if macro favors longs, shorts, or neutral. If neutral or conflicted, reduce size or wait.
- 15M bias: Identify whether price is above or below the 50 EMA. Mark the most recent swing high and swing low. These are your liquidity targets.
- 5M structure: Mark VWAP, session open price, and any visible order blocks or FVGs from the prior session or overnight range.
- 1M entry zone: Identify the specific FVG or order-block retest area where you'll enter if a sweep occurs.
- Spread and session check: Confirm live spread is below $0.25. Confirm you are in London open or London–New York overlap. Check the economic calendar for any news in the next 30 minutes.
Checklist stop conditions — cancel the session if:
- Any Tier-1 US data (CPI, NFP, FOMC) is within 15 minutes
- Live spread exceeds $0.25
- Daily loss limit (2%) has already been hit
- DXY and gold are showing correlation breakdown (moving together)
- You've already taken three consecutive losing trades
Pro Tip: Mark your key levels the night before or 30 minutes before the London open. Levels drawn in real time during a fast move are drawn under pressure and are usually wrong. Pre-marked levels let you react instead of analyze.
What are the exact entry rules for a liquidity-sweep setup?
The entry method here is the liquidity-sweep plus FVG retest, and it has a strict sequence. Deviating from the sequence is what turns a high-probability setup into a random trade.
The four-step entry sequence
- HTF bias confirmed: 15M price is above the 50 EMA (long bias) or below it (short bias). No trades against this filter.
- Liquidity sweep occurs: Price runs above a recent swing high (for a short setup) or below a recent swing low (for a long setup), triggering stop orders and creating a wick.
- Candle closes back inside the range: The sweep candle must close back inside the prior range. A close outside means the breakout may be genuine. This close-back requirement is the key confirmation that separates a trap from a real breakout.
- FVG or order-block retest: After the close-back, price retraces into the FVG left by the sweep candle. Enter at the FVG midpoint with a limit order, or on the next candle's open if using a market order.
Confirmation filters
- RSI (7-period) showing divergence or returning from an extreme (below 30 for longs, above 70 for shorts)
- 5M EMA 9 crossing above EMA 21 for longs (or below for shorts) within the last 1–3 candles
- VWAP on the same side as your bias (price above VWAP for longs)
Invalid entry scenarios
- Chasing the breakout candle before the close-back
- Entering during a news spike with no clear sweep structure
- Taking a trade when the 15M bias is against your direction
- Entering when the spread is above $0.25
For deeper reading on FVG and order-block entry mechanics, the reclaim-entry framework applies directly to this sequence.
Pro Tip: Use a limit order placed at the FVG midpoint rather than a market order. You get a better fill, and if price never retraces to your zone, you simply don't take the trade. Missed trades cost nothing; bad fills cost real money.
How do you set stops, take profits, and manage the trade?
Stop loss placement
Place the stop beyond the sweep wick, not at a round number. The sweep wick is the structural invalidation point: if price returns there, the setup is wrong. Use ATR(14) as a sanity check — your stop should be at least 0.5× ATR from entry to avoid being stopped by normal noise. On a typical 5M gold scalp, that often means a stop of 8–12 pips ($0.80–$1.20 per unit).
Take-profit rules
Target a minimum 1:2 risk-to-reward. On a 10-pip stop, that's a 20-pip target. Scale out in two pieces:
- Partial close (50–60% of position): at 1:1 RR, moving the stop to breakeven on the remainder
- Runner: trail the stop using the 5M EMA 9 or a 0.5× ATR trail; let it run until the trail is hit or a new opposing sweep forms
Time-based exits
Gold scalps on 1M–5M charts should resolve within 15–30 minutes. If a trade is still open and hasn't reached the first target after 30 minutes, close it regardless of P&L. Scalps that linger become swing trades by default, with wider risk than the original setup assumed.
Moving to breakeven
Move the stop to breakeven once price has moved 1× ATR in your favor. Don't move it earlier — premature breakeven stops get hit by normal retracements and turn winning setups into scratch trades.
Pro Tip: When volatility surges mid-trade (a sudden news headline or DXY spike), close the partial immediately rather than waiting for the 1:1 target. A guaranteed partial win beats a potential full loss when conditions change without warning.
How do you size positions and protect the account?
Position-sizing formula
The formula is straightforward:
Lot size = (Account $ × Risk %) ÷ (Stop in pips × Pip value)
For XAU/USD, 1 standard lot = $10 per pip (1 pip = $0.10 move on gold). On a $10,000 account risking 1% ($100) with a 10-pip stop:
Lot size = $100 ÷ (10 × $10) = 1.0 standard lot
On a $5,000 account with the same parameters: 0.5 lots. Scale down proportionally and never override the formula because a setup "looks strong."
Risk limits
A disciplined risk protocol of 0.5–1% per trade and a 2% daily maximum loss is the standard for retail XAU/USD scalpers. Add a hard stop after three consecutive losses in a session — close the platform and return the next day.
Spread and commission in the sizing calculation
Your actual risk per trade is: (stop in pips + spread in pips) × pip value × lot size. On a 10-pip stop with a $0.20 spread, your true risk is 12 pips, not 10. Factor the spread into the denominator of the sizing formula, not as an afterthought.
For a full risk management checklist covering per-trade and daily limits, the framework maps directly to gold scalping parameters.
Pro Tip: Use ATR gating on position size. Higher volatility means wider natural swings and a higher probability of stop-outs on otherwise valid setups.
When are the best times to scalp gold, and what should you avoid?
London open and the London–New York overlap are the prime sessions for XAU/USD scalping. London open (3:00–5:00 AM ET) delivers the first directional move of the day, often sweeping overnight highs or lows before establishing a trend. The overlap (8:00–11:00 AM ET) brings US volume into an already-moving market, creating the cleanest liquidity sweeps and the tightest spreads of the day.
High-probability windows:
- London open: 3:00–5:00 AM ET (first 30–60 minutes of directional move)
- London–New York overlap: 8:00–11:00 AM ET (highest liquidity, tightest spreads)
- Post-US open continuation: 9:30–10:30 AM ET if a clear trend is established
Avoid these conditions:
- Asian session (10:00 PM–3:00 AM ET): thin liquidity, wide spreads, choppy price action
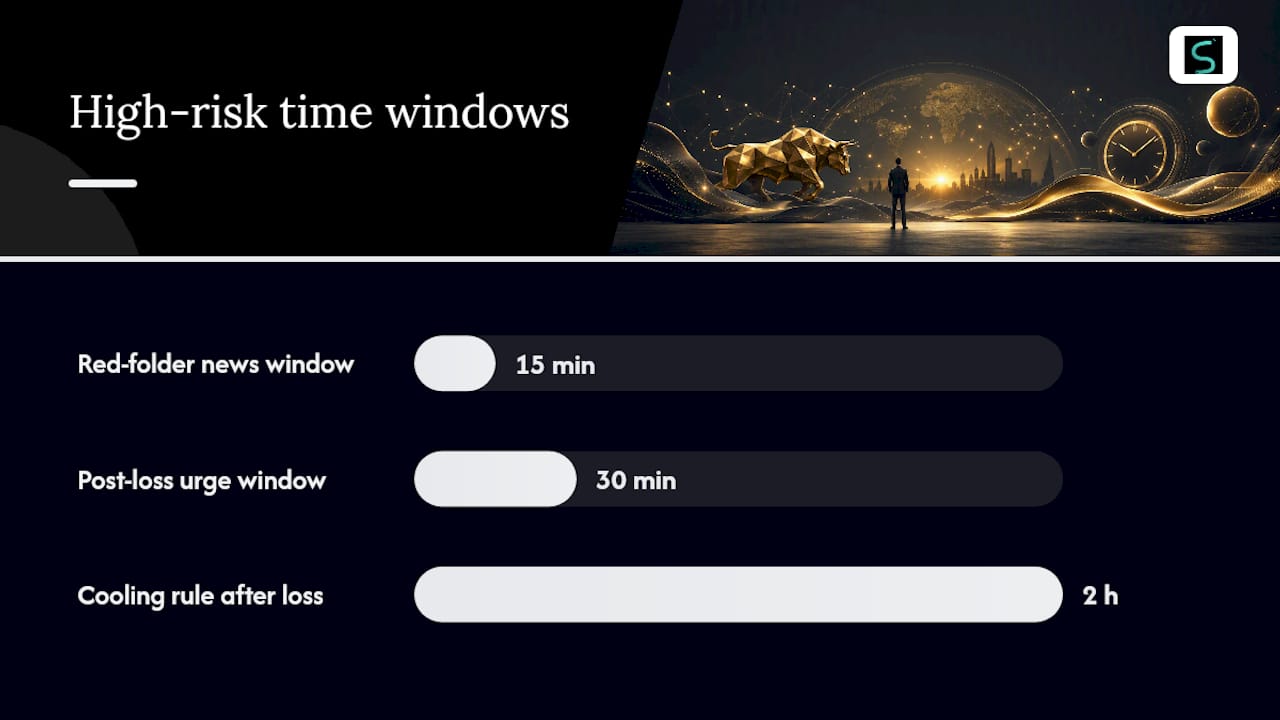
- 15 minutes before and after CPI, NFP, FOMC, or any red-folder US data
- First 5 minutes of any major session open (spreads spike briefly)
- Friday afternoon after 12:00 PM ET (liquidity drops sharply into the weekend)
Spread thresholds as go/no-go signals: below $0.20 is ideal, $0.20–$0.25 is acceptable, above $0.25 is a no-trade condition. Monitor the live spread widget, not the advertised average — spreads widen significantly around news and at session transitions.
Pro Tip: The best scalp pockets within the London–New York overlap are usually 8:30–9:15 AM ET and 10:00–11:00 AM ET. The 9:15–10:00 AM window often contains residual news volatility from US open data. Slot your setups around those pockets.
How do you backtest this setup and know if you have a real edge?
Backtest setup
Use TradingView's replay function or a dedicated backtesting platform. Apply the session filter (London open and overlap only), set the spread assumption at $0.20–$0.25, and add $0.05 slippage per side. Run the test on at least 100 trades; a 100–500-trade sample is the practical minimum for estimating expectancy and max drawdown with statistical stability.
Metrics to capture
- Win rate: target above 45% with a 1:2 RR minimum (a 45% win rate at 1:2 RR produces a positive expectancy)
- Average R multiple: the average profit or loss expressed as a multiple of the initial risk; aim for 0.4R or higher
- Expectancy: (Win rate × Avg win) minus (Loss rate × Avg loss); must be positive
- Max drawdown: the largest peak-to-trough equity drop in the sample; if it exceeds 10%, the sizing or rules need adjustment
- Trade frequency: how many qualifying setups appear per session; if fewer than 1–2 per day, the filter is too tight
Sensitivity testing
Run the same backtest with spread assumptions at $0.30 and $0.35. If the expectancy turns negative at $0.30, the edge is too thin for real-world execution. A robust setup stays positive at $0.30 and only turns marginal at $0.35.
A 100-trade minimum sample is the floor, not the target. At 100 trades, variance is still high enough to produce misleading win rates. At 300–500 trades across multiple sessions and market conditions, the metrics stabilize and give you a realistic read on whether the setup has a genuine edge.
What mistakes do gold scalpers make most often?
Most scalping accounts don't blow up on one bad trade. They erode through repeated small violations of the rules above.
Top mistakes:
- Ignoring the spread: entering when the spread is $0.30+ because the setup "looks perfect"
- Trading against HTF bias: taking a long on the 1M when the 15M is below the 50 EMA
- Overtrading: taking 8–10 trades in a session when only 2–3 qualified under the rules
- Moving stops wider: adjusting a stop because "it's almost there" instead of accepting the loss
- Trading through news: staying in a position through a CPI release because it was already open
Do/don't checklist before each session:
| Do | Don't |
|---|---|
| Check DXY and real yields first | Open a chart before checking macro |
| Confirm spread is below $0.25 | Trade during Asian session |
| Mark key levels before the open | Enter on the breakout candle |
| Set a hard daily loss limit | Move stops wider after entry |
| Stop after 3 consecutive losses | Trade within 15 min of red-folder news |
Diagnosing a losing day: after a bad session, log the spread at entry, whether the HTF bias was aligned, whether you waited for the close-back, and whether news was nearby. Most losing days trace back to one or two of those four variables.
Pro Tip: The fastest way to stop revenge trading is a physical rule: after hitting the daily loss limit, close TradingView entirely and do something else for at least two hours. The urge to "make it back" is strongest in the 30 minutes after a loss. That window is when the most damage happens.
Why the macro-first, liquidity-sweep approach is our preferred edge
Most retail scalping guides start with the chart. We start with the dollar. That sequence difference is not cosmetic — it changes which trades you take.
When DXY is trending up and real yields are rising, gold is fighting macro gravity on every long setup. The chart might show a clean liquidity sweep and FVG retest, but the macro headwind means the setup needs to overcome a structural force that doesn't show up on a 5-minute candle. Applying the macro-first framework before touching the chart filters out a meaningful category of technically valid but contextually weak trades.
The liquidity-sweep entry beats naive pattern trading for a specific reason: it exploits the behavior of algorithmic stop-hunters. When price sweeps a swing high and immediately reverses, it's often because an algorithm ran stops and then reversed. Waiting for the reclaim and FVG retest means you're entering after the trap has already sprung, not into it. That timing shift is the difference between being the hunted and being the one who follows the hunt.
On mindset: scalping gold requires accepting that you will miss setups. The discipline is in the filter, not in the frequency. A trader who takes 3 high-quality trades per session and follows the rules consistently will outperform one who takes 10 trades and bends the rules on half of them. The role of volatility in scalping and how it interacts with position sizing is worth studying separately — it's the variable most traders underestimate when they move from demo to live.
Scalping-algo gives you the signals and automation to run this faster
Running this strategy manually requires watching three timeframes, tracking DXY, monitoring spreads, and executing entries in seconds. Scalping-algo's premium TradingView indicator suite is built specifically for this workflow.

The Algo Master suite handles multi-timeframe confluence, FVG and order-block detection, and non-repainting buy/sell signals on 1M–15M charts, all in Pine Script v6. Webhook alerts fire directly to Discord the moment a signal triggers, so you're not watching the screen waiting for a setup. The built-in backtesting dashboard lets you run the 100–500-trade sample this guide recommends without building a custom spreadsheet. Start with 20 demo trades using the indicators alongside the entry rules above, log the results in the dashboard, and check whether your win rate and R multiple match the backtest. Visit the Algo Master page to see the full indicator suite and get started.
Sources
These are the primary references used in this guide. Each one covers a specific layer of the strategy.
- How to Trade Gold | KenMacro
- Gold Scalping Strategy: M5 Chart Setup That Works (2026) | GoldTraderMo
- Gold Scalping Strategy, Examples, and Trading Tips | DailyForex
This article is general information, not a substitute for advice from a qualified financial advisor. Consult a qualified financial professional about your own circumstances before acting on anything here.