

A pullback stock is a stock whose price has dipped temporarily inside an otherwise intact uptrend. That's the whole definition. It's not a crash, and it's not a reason to panic. Three things to do right now:
- Check the trend first. Is the stock still above its 50-day or 200-day moving average, and is that average still sloping up? If not, skip it.
- Use limit orders near support, not market orders. A market order into a falling stock gets you a worse fill than you planned.
- Cap your risk before you click buy. Risk no more than 1-2% of your account on any single pullback trade.
Skip the trade if volume is rising as the price falls, or if there's no confirmation candle at support yet. That's not a pullback setup. That's a stock still falling.
Key Takeaways
A pullback stock offers a repeatable, testable setup only when trend, support, volume, and confirmation all line up before entry.
| Point | Details |
|---|---|
| Definition first | A pullback is a temporary dip inside an intact uptrend, not a trend change. |
| Size and frequency | Small 5% dips happen almost yearly; 20%+ bear markets appear roughly every four years. |
| Volume is the tell | Lighter volume on the dip signals health; rising volume signals distribution or reversal risk. |
| Confirm before entering | Use a confirmation candle plus moving-average or pivot support before placing an order. |
| Size positions by risk | Set your dollar risk first, then calculate share size from your stop distance. |
Table of Contents
- Pullback Stock Definition, Percent Thresholds, and How Often They Happen
- Is It a Pullback, a Correction, or a Reversal?
- What Technical Signals Confirm a Pullback Stock?
- How Do You Actually Trade a Pullback Stock?
- Warning Signs a Pullback Is Turning Into a Reversal
- A Pullback Trading Checklist and Simple Backtest Workflow
- Strategy vs. Psychology: What Actually Determines Results
- Frequently Asked Questions
- Sources
Pullback Stock Definition, Percent Thresholds, and How Often They Happen
A pullback is a short-term decline within a larger uptrend, not random noise and not a trend change. The distinction matters: normal volatility bounces in both directions without direction, while a genuine pullback stock retreats from a clear high inside a chart that's still pointed up.
Traders size pullbacks by percentage drop from the recent high:
5% = speed bump. Barely worth flagging. 10% = correction territory. Where most traders start paying attention. 15% = deeper pullback. Support levels get tested hard. 20%+ = bear market. A different conversation entirely.
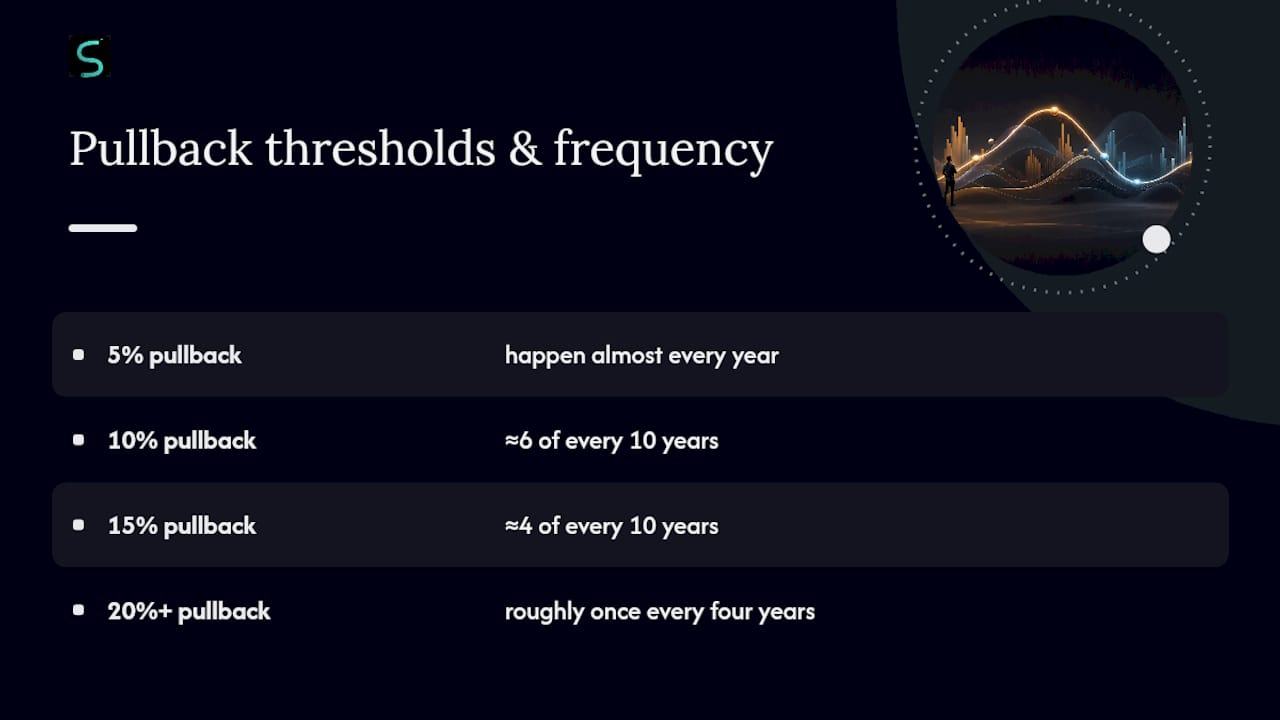
Frequency backs this up. Historical S&P patterns show 5% dips happen almost every year, 10% corrections show up in roughly 6 of every 10 years, 15% pullbacks in about 4 of every 10 years, and 20%+ bear markets arrive roughly once every four years on average. For long-term investors, that means shallow pullbacks are just the market breathing. For active traders, it means setups show up regularly enough to build a repeatable system around.
Is It a Pullback, a Correction, or a Reversal?
These three get used interchangeably, and that's a mistake. A pullback is short, shallow, and the trend structure stays intact. A correction is a deeper, often 10%+ pullback that still resolves back into the primary trend. A reversal is different in kind, not degree: it shows a permanent change in direction, not a pause.
The technical divide comes down to duration, breadth, and moving-average slope. A pullback holds prior support and the average keeps climbing. A reversal breaks support on heavy volume while the average flattens or rolls over.
Quickest tell: if a key support level breaks on above-average volume and the moving average's slope turns down, you're probably watching a reversal, not a pullback.
What Technical Signals Confirm a Pullback Stock?
Retail traders don't need a dozen indicators. They need a handful that actually earn their place on the chart.
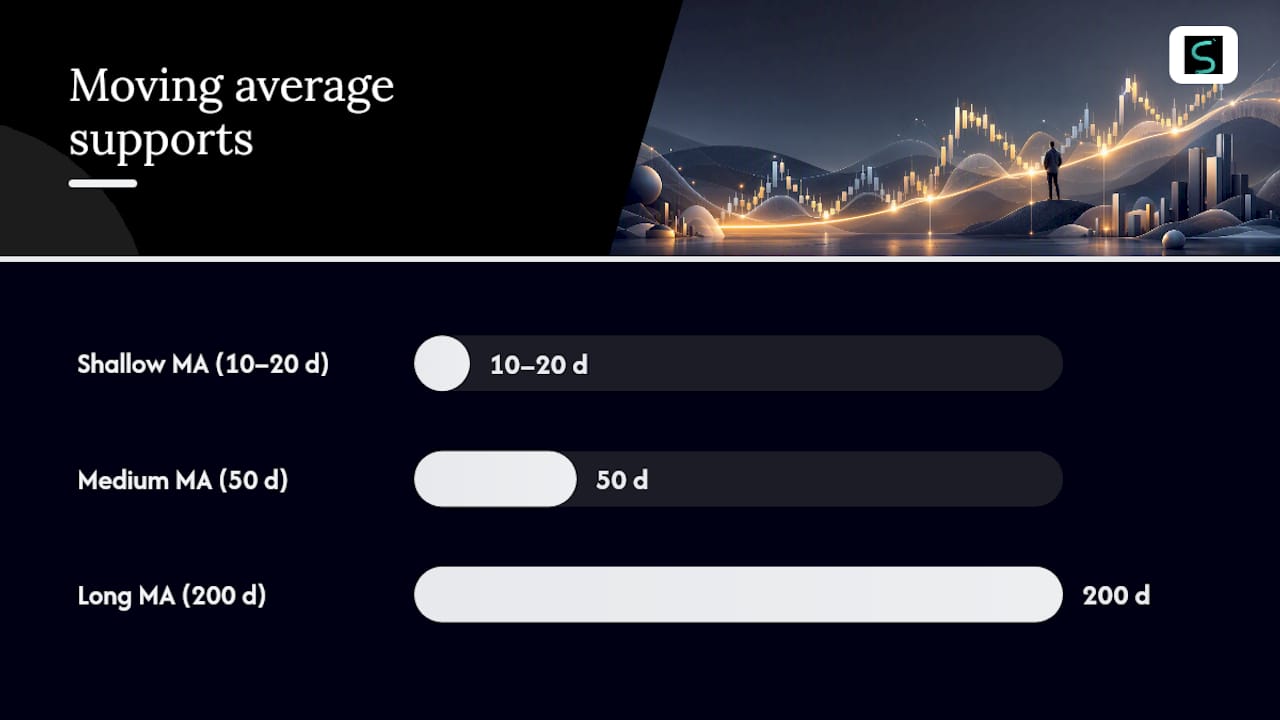
Moving averages do most of the heavy lifting. Shallow pullbacks tend to hold the 10 or 20-day line; medium-term dips find support closer to the 50-day, which most traders treat as a more reliable floor. A break well below the 200-day is a warning that trend damage may be setting in, not just a temporary dip.
Other tools worth watching:
- VWAP for intraday pullback entries, especially on liquid names
- Prior pivot highs/lows, which often become support once price returns to them
- Fibonacci retracements (the 38.2%, 50%, and 61.8% levels) for gauging how deep a pullback might reasonably go
- RSI, useful for spotting oversold conditions that often precede a bounce
- Volume, the single most important confirmation tool on this list
Timeframe matters too. Swing traders and investors lean on daily charts. Intraday traders working 1-hour or 15-minute charts need tighter, faster confirmation, since pullbacks on lower timeframes resolve in hours, not days.
Pro Tip: Compare the volume on the pullback to the volume on the prior up-leg. A healthy pullback shows noticeably lighter volume on the decline. If volume expands as price falls, that's distribution, not a discount, and it changes the whole read on the setup.
How Do You Actually Trade a Pullback Stock?
Two entry methods cover most situations. A limit buy order placed directly at your support zone works when you want a precise fill and don't mind missing the trade if price never gets there. A buy-stop order placed just above a confirmation candle's high works when you want proof the bounce is already happening before you commit capital.
Stop-loss placement follows the same logic every time: just below the support level, just below the moving average you're using, or a set distance based on the stock's average volatility, as explained in these risk management rules new traders must know. Whichever you choose, keep it consistent across every pullback trade you take, so your results are comparable.
This keeps every trade risking the same amount regardless of how volatile the stock is.
Order types to know:
- Limit order — guarantees your price, not your fill
- Stop-entry order — triggers a market order once price hits your level
- Stop-limit order — triggers a limit order instead, protecting against slippage in fast markets
Some traders scale in, buying a partial position at the first support test and adding more on confirmation, rather than committing everything at once. For managing trade exits, set an initial target based on the prior high or a measured move, then trail your stop up as price advances. A pullback trade might resolve in a few days on a daily chart, or a few hours intraday. Give it room to work, but don't hold past your original thesis.
Warning Signs a Pullback Is Turning Into a Reversal
Watch for these together, not in isolation: rising volume on the way down, a moving average flattening or rolling over, deteriorating market breadth, repeated support breaks, and divergence between price and institutional-volume indicators.
Each one calls for a specific response. High volume selling? Tighten your stop toward breakeven immediately. Moving average rolling over? Cut position size by half rather than waiting for a full stop-out. Repeated support breaks? Exit; don't average down into a broken level.
Long-term investors can mostly ignore single red flags and wait for multiple confirmations before trimming a core position. Active traders should treat even one red flag as a reason to act, since the cost of being wrong compounds fast on shorter timeframes.
A Pullback Trading Checklist and Simple Backtest Workflow
Run this sequence before every entry:
- Confirm the trend — price above the relevant moving average, average still rising
- Check pullback location — has price reached a logical support zone (moving average, pivot, Fibonacci level)?
- Verify volume — lighter on the dip than on the prior up-leg
- Wait for a confirmation candle — a close that shows buyers stepping back in at support
- Set entry, stop, and target — before you place the order, not after
To validate this before risking real money, pick a universe of liquid stocks or ETFs, define your exact rules, and run them against a couple hundred historical setups. Track win rate, average R multiple, expectancy, and max drawdown across different market conditions, not just a single bull run.
Pro Tip: Once backtesting shows an edge, paper trade it live for several weeks before using real capital. Backtests can't fully capture slippage or how you'll actually behave when a trade moves against you in real time.
Strategy vs. Psychology: What Actually Determines Results
The hardest part of pullback trading isn't the chart. It's accepting that waiting for confirmation means missing some winners. Early entries catch more of the move but also catch more false starts. Confirmation costs you some upside in exchange for fewer losing trades. That tradeoff is the whole game.
Two habits separate consistent traders from the rest: they manage FOMO by sticking to their entry rules even when a stock runs without them, and they follow their stop without renegotiating it mid-trade. Pullback setups work best as a tactical sleeve alongside core, longer-term holdings, not as the entire portfolio.
Frequently Asked Questions
What percentage counts as a pullback versus a correction?
How long do pullbacks usually last? Days to a few weeks on daily charts is typical. Intraday pullbacks on 1-hour or 15-minute charts often resolve within hours.
Can a pullback happen in ETFs and sectors, not just individual stocks? Yes. The same rules apply, though liquid ETFs and large-cap sectors tend to produce cleaner, more reliable pullback structures than thinly traded small caps.
What's the biggest mistake new traders make trading pullbacks? Buying the dip without waiting for a confirmation candle or checking volume, which turns a mechanical setup into a guess.
Do macro events change how pullbacks behave? Yes. News events and shifts in interest-rate expectations can turn an ordinary pullback into a sharper, faster decline, which is why checking volume and breadth matters more during volatile macro periods.
This article is general information, not a substitute for advice from a qualified financial advisor. Consult a qualified financial professional about your own circumstances before acting on anything here.
Sources
- Pullback: What It Means in Trading, With Examples
- Stock Market Pullbacks: What They Are and How Often They Happen
- Investor