

What is technical analysis?
Technical analysis is the study of past price and volume data to forecast where a market is likely to move next. Rather than asking "is this company profitable?" it asks "what is the price doing, and where is it headed?" Traders use it to time entries and exits across stocks, forex, crypto, commodities, and futures.
The method rests on price charts and volume patterns rather than earnings reports or balance sheets. A technical analyst looks at what the market has already done and uses that history to build a probability-based view of what comes next. Think of it as reading the market's footprints.
Key elements technical analysis covers:
- Price trends: directional movement up, down, or sideways over time
- Volume patterns: how much activity backs a price move
- Chart patterns: recurring formations like head and shoulders or triangles
- Indicators: mathematical tools like the Relative Strength Index (RSI) and moving averages
- Market sentiment: the collective psychology driving buying and selling pressure
The roots of modern technical analysis trace back to Dow Theory, developed around 1900 by Charles Dow. His core ideas, that prices discount all information, move in trends, and repeat due to human behavior, still underpin every chart-reading method used today.
The three core principles every trader should know
Technical analysis is not a collection of random rules. It is built on three foundational assumptions that, once understood, make every chart pattern and indicator click into place.

1. Markets discount everything. The current price already reflects all publicly known information, from earnings reports to geopolitical news. A technical analyst does not need to read the news to trade the news. The price chart has already processed it. This idea comes directly from Dow Theory and aligns loosely with the Efficient Market Hypothesis, though technicians argue that price action still reveals exploitable patterns even in efficient markets.
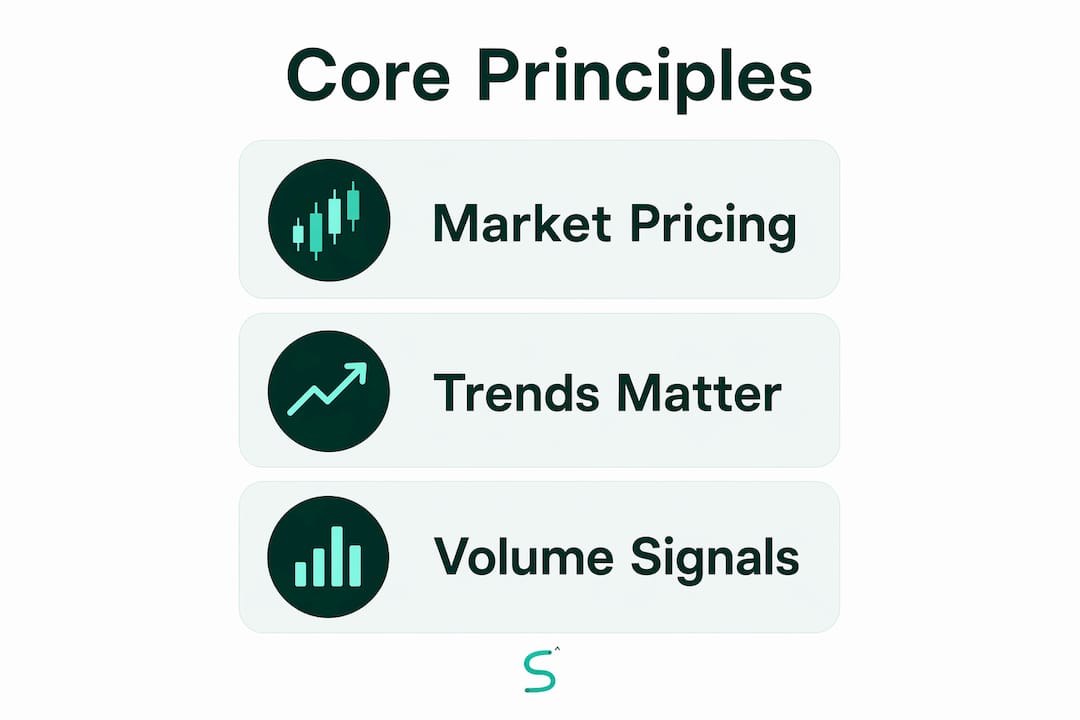
2. Prices move in trends. Markets spend more time trending than moving randomly. Once a trend is established, it tends to continue until a clear reversal signal appears. This is why trend-following remains one of the most durable strategies in trading.
3. History repeats itself. Human psychology drives markets, and human psychology does not change. Fear, greed, and herd behavior create the same price formations over and over. Recognizing those formations gives traders a statistical edge.
- Markets discount all available information into the current price
- Trends persist until a reversal is confirmed
- Repetitive patterns emerge from collective investor behavior
- Dow Theory provides the historical framework for all three principles
- Market psychology drives supply and demand, which drives price
Pro Tip: Don't memorize patterns before you understand why they form. Once you see that a "head and shoulders" pattern reflects a failed attempt to make a new high, the pattern stops looking like a random shape and starts making sense.
Technical analysis vs. fundamental and quantitative analysis
Traders often debate which method is "better." The honest answer is that each approach answers a different question, and the best traders usually use more than one.
Fundamental analysis focuses on a company's intrinsic value. Analysts examine earnings, dividends, debt levels, and economic conditions to decide whether an asset is overpriced or underpriced. Fundamental analysts look at EBITDA, management changes, and industry trends. They care about what to buy. Technical analysis, by contrast, does not measure intrinsic value at all. It studies price trends to forecast future movement, focusing on when to buy or sell.
Quantitative analysis sits in a third lane. It uses algorithmic, data-driven models, often combining price data with fundamental metrics, to generate trading signals at scale. Quant strategies can incorporate technical indicators like moving averages alongside fundamental ratios, running them through statistical models rather than visual chart reading.
Here is how the three approaches compare in practice:
| Approach | Primary data used | Main question answered | Typical use case |
|---|---|---|---|
| Technical | Price and volume | When to enter or exit | Short to medium-term trading |
| Fundamental | Financials, economics | What to buy or sell | Long-term investing |
| Quantitative | Algorithms, mixed data | How to model and automate | Systematic trading |
Combining technical and fundamental analysis gives traders a fuller picture. Many use fundamentals to select which assets to trade and technical tools to time their entries and exits precisely.
Charts, indicators, and patterns you need to know
This is where technical analysis gets practical. The tools below are the building blocks of almost every trading strategy you will encounter.
Chart types
Line charts connect closing prices over time. Simple and clean, they are best for spotting broad trends but hide intraday price action.
Bar charts show the open, high, low, and close (OHLC) for each period. More detail than a line chart, but harder to read quickly.
Candlestick charts are the standard for most active traders. Each candle shows the same OHLC data as a bar chart but uses color-coded bodies that make price action immediately visible. Candlesticks are preferred for detailed price action analysis because patterns like doji, engulfing, and hammer formations are easy to spot at a glance.
Key indicators
- Simple Moving Average (SMA): averages closing prices over a set period; smooths out noise to reveal trend direction
- Exponential Moving Average (EMA): weights recent prices more heavily; reacts faster to price changes than the SMA
- RSI (Relative Strength Index): oscillates between 0 and 100; readings above 70 suggest overbought conditions, below 30 suggest oversold
- MACD (Moving Average Convergence Divergence): tracks the relationship between two EMAs; crossovers signal potential trend shifts
- Bollinger Bands: plot two standard deviations above and below a moving average; price touching the outer bands can signal reversals or breakouts
- Fibonacci retracements: horizontal levels at key ratios (23.6%, 38.2%, 61.8%) that often act as support or resistance during pullbacks
Chart patterns
Patterns are formations that repeat because the psychology behind them repeats. The most widely followed include:
- Head and shoulders: a peak, a higher peak, and a lower peak; signals a trend reversal from bullish to bearish
- Double top / double bottom: two failed attempts to break a price level; double tops signal reversals down, double bottoms signal reversals up
- Triangles (ascending, descending, symmetrical): consolidation patterns where price compresses before a breakout in either direction
Volume: the confirmation tool
Volume confirms price movements and separates genuine breakouts from false ones. A price move on high volume carries more weight than the same move on thin volume. If a stock breaks above resistance on three times its average daily volume, that breakout is far more credible than one on below-average activity.

Timeframes and their role
The timeframe you trade on shapes everything you see. Higher timeframe charts like daily and weekly charts carry less noise and produce more reliable signals. Short timeframes (1m–15m) show more trades but also more false signals. Many traders use a top-down approach: read the weekly chart for trend direction, the daily for setup context, and the 1-hour or 15-minute chart for entry timing.
Common strategies
Trend following means trading in the direction of the established trend. You buy pullbacks in an uptrend and sell rallies in a downtrend. Tools like moving averages and trendlines define the trend. For a deeper look at executing this step by step, the trend analysis guide at Scalping-algo walks through the full process.
Mean reversion bets that price will return to its average after an extreme move. Bollinger Bands and RSI are the go-to tools here. When price stretches far from its moving average and RSI hits an extreme, mean reversion traders look for a snap back.
Pro Tip: Never use an indicator in isolation. A bullish RSI signal on a 5-minute chart means very little if the daily trend is firmly bearish. Always check the higher timeframe first.
How to start learning and applying technical analysis
The gap between understanding technical analysis and actually using it profitably comes down to one thing: structured, deliberate practice. Here is how to close that gap without blowing up a real account.
Start with the basics, not the exotic. Before you touch oscillators or Fibonacci extensions, get comfortable with support and resistance levels, trendlines, and a simple moving average. These three tools alone can build a complete trading framework. Beginners should focus on support/resistance and simple moving averages before advancing to complex indicators.
Practice on a demo account first. Paper trading or a demo account lets you apply what you learn without risking real capital. You will make mistakes, and that is the point. Getting those mistakes out of the way in a risk-free environment is how you build real confidence. If you have not set one up yet, the demo trading guide at Scalping-algo covers exactly how to get started.
Use backtesting to validate your ideas. Before trading any strategy live, backtesting on historical data helps you understand how it would have performed. It builds confidence and surfaces weaknesses before they cost you real money.
Prioritize psychology over tools. Technical analysis is ultimately a study of market psychology and supply-demand dynamics. Traders who understand why a pattern forms consistently outperform those who just memorize what it looks like. The chart is a map of human emotion, and reading it well requires understanding fear and greed as much as RSI levels.
Favor higher timeframes early on. The daily and weekly charts are more forgiving for beginners. Less noise means cleaner signals and more time to think through your decisions. Once you are consistent on higher timeframes, you can explore short-term strategies on lower timeframes with a clearer foundation.
Practical steps to build your skills:
- Study one chart type and one indicator at a time; master it before adding more
- Keep a trading journal noting every trade, the setup, and the outcome
- Review losing trades as carefully as winning ones
- Use reputable platforms like TradingView to chart and practice; the TradingView setup guide at Scalping-algo gets you running in minutes
- Combine technical study with basic fundamental awareness for context
Pro Tip: Over-optimizing your indicators to fit historical data is one of the most common beginner mistakes. A strategy that works perfectly on past data but fails in live markets is called curve-fitting. Keep your setups simple and test them across different market conditions, not just the ones where they look great.
For traders who want structured training on reading price action directly, the Advanced Price Action course from Markets Factor covers the core skills in a focused format.
Ready to put technical analysis into practice?

Scalping-algo builds professional-grade TradingView indicators specifically designed for traders who want to apply technical analysis in real time. The tools generate non-repainting buy and sell signals across crypto, forex, indices, and futures, with built-in confluence filters and volatility gating to cut through noise on any timeframe.
Whether you are just getting started or looking to sharpen your execution, the Scalping-algo indicator suite gives you the technical edge without the guesswork. For traders focused on short-term setups, the Algo Master system combines three indicators into one coordinated framework built for precision entries and exits.
Key Takeaways
Technical analysis gives traders a structured, repeatable way to read price behavior and time decisions across any market or timeframe.
| Point | Details |
|---|---|
| Core definition | Technical analysis studies past price and volume data to forecast future market direction. |
| Three foundational principles | Markets discount everything, prices trend, and history repeats due to human psychology. |
| Essential tools | Candlestick charts, moving averages, RSI, MACD, Bollinger Bands, and Fibonacci retracements are the core toolkit. |
| Volume confirms signals | High-volume price moves are more reliable than low-volume ones; volume separates real breakouts from false ones. |
| Best learning path | Start with support/resistance and simple moving averages, practice on a demo account, and backtest before going live. |