
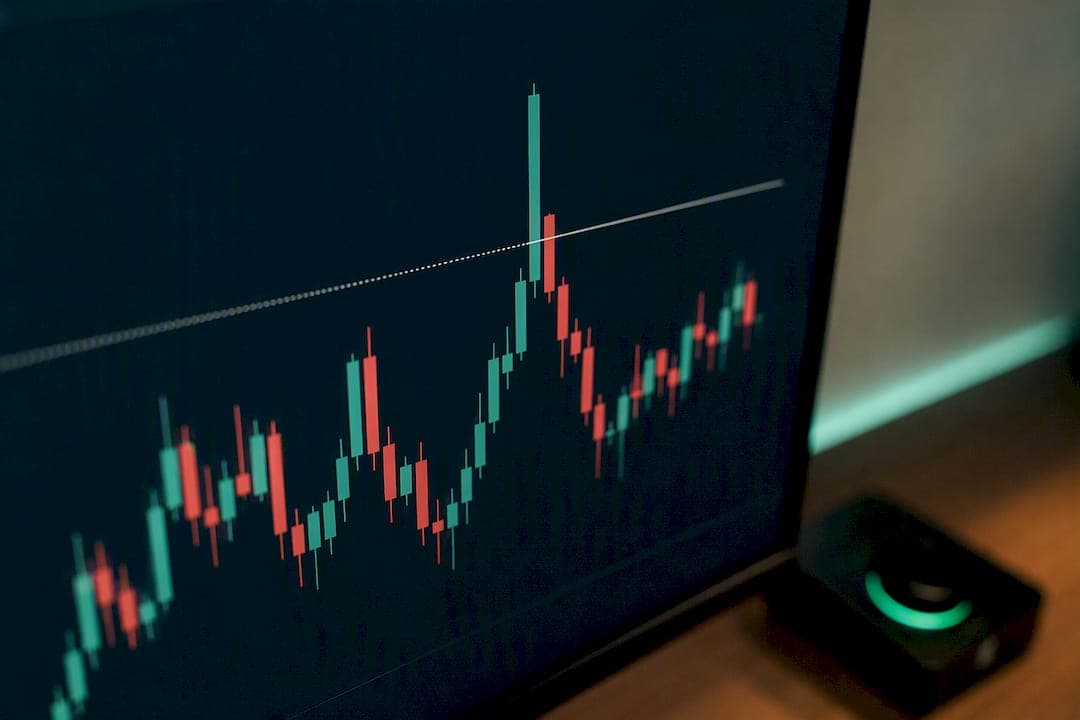
Trade liquidity grabs by fading wicks that close back inside key, pre-marked levels, and never fade a wick alone. Require a volume spike and higher-timeframe alignment before you commit size. Stop just beyond the sweep wick, target the opposite liquidity pool or a fixed R multiple, and if price accepts beyond the level with a strong close instead of snapping back, you follow the breakout rather than fade it.
TL;DR:
- Liquidity sweeps are confirmed by a wick piercing a level on high volume and closing back inside range, not by the wick alone.
- Key levels for potential sweeps include equal highs or lows, previous session extremes, round numbers, and multi-touch swing points, confirmed on higher timeframes.
- Entry triggers should wait for a candle to close back inside the level, with stops placed just beyond the wick, and confirmed volume above recent averages.
- Using objective, testable rules such as breach size, volume thresholds, and timeframe alignment reduces false signals and improves trade discipline.
- Automation tools like non-repainting indicators can assist with spotting levels and confirming sweeps but should not replace manual level marking and final validation.
Table of Contents
- What a Liquidity Grab Actually Looks Like on a Chart
- The Three-Phase Rhythm: Inducement, Sweep, Reversal
- Where Liquidity Pools Actually Form
- Objective Rules for Spotting a Real Sweep
- Three Ways to Enter After a Confirmed Sweep
- Stop Placement, Sizing, and Where to Take Profit
- Two Worked Examples: A Long and a Short
- How Indicator Tools Fit Into a Sweep Strategy
- The Mistakes That Wreck a Sweep Trade
- Building a Practice Plan Before You Scale Size
- Where Scalping-Algo Fits This Workflow
- Sources
- FAQ
What a Liquidity Grab Actually Looks Like on a Chart
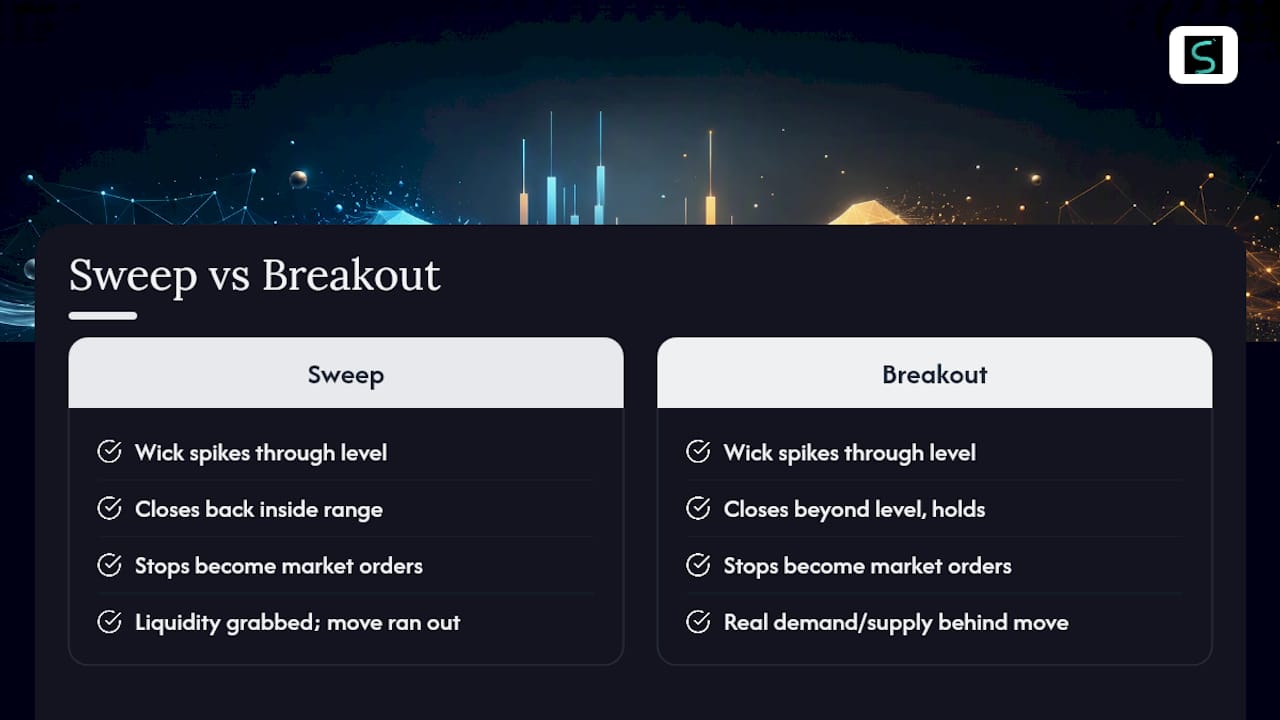
A liquidity grab happens when price spikes through an obvious high or low, triggers the stop orders sitting there, then closes back inside the range. That's the whole mechanic, and you can see it on any chart without guessing at motive. The close-back-inside rule is what separates a genuine sweep from a real breakout: a sweep wicks through and closes back in, a breakout wicks through and stays out.
Here's why this matters for trade selection. Stop orders resting above a swing high or below a swing low aren't passive. Once triggered, they become market orders, and a cluster of them firing at once is exactly what fuels the sharp spike you see on the wick. That's the liquidity being "grabbed."
The practical consequence is simple: a wick that reverses tells you the aggressive move ran out of fuel once the stops cleared, so you fade it. A candle that closes beyond the level and holds tells you real demand or supply is behind the move, so you follow it. Confusing the two is the single most common error in liquidity sweep trading, and it's why the close, not the wick, is the only thing worth reacting to.
The Three-Phase Rhythm: Inducement, Sweep, Reversal
Every clean liquidity grab follows the same rhythm, and marking each phase on your chart turns a vague concept into something you can actually trade.
Inducement comes first. Price consolidates near an obvious level, equal highs, equal lows, a prior day's close, and traders position stops just beyond it. This is the setup phase; nothing to do here except mark the level and wait.
Sweep is the spike itself. Price pierces the level, often on a sudden burst of volume, as clustered stops fire and get filled. Treating this as confluence rather than a standalone signal is the difference between a disciplined sweep trader and someone chasing every wick on the chart.
Reversal is the close-back-inside candle, ideally with volume that fades as price returns to range. That fade in volume matters. A sweep on rising volume that keeps rising is often acceptance, not rejection.
- Mark the inducement zone before the session starts, not after.
- Watch for a volume spike concentrated on the sweep candle itself, not a slow bleed.
- Confirm the reversal candle closes back inside before you do anything.
Pro Tip: Separate what you can prove from what you can't. You can verify that stops clustered and orders triggered. You cannot verify that a specific desk "engineered" the move on purpose, and that distinction between mechanics and market manipulation matters if you're building rules instead of a story.
Where Liquidity Pools Actually Form
Sweeps only mean something if you've pre-marked the level they're sweeping. Random wicks in the middle of a range aren't liquidity grabs, they're noise.
- Equal highs and equal lows. Two or more touches at nearly the same price signal a resting cluster of stops, and the more touches, the heavier the pool.
- Prior session extremes. Yesterday's high and low, the Asian session range, or the prior week's close all attract stop placement from traders who set levels off session data.
- Round numbers. Psychological levels like 1.1000 on EUR/USD or 50,000 on BTC draw retail stops in bunches, even without a technical reason.
- Trendline pivots and multi-touch swings. A swing point that's been tested three or four times carries more weight than a single spike high.
Confirm a level is "real" by checking two things: has price reacted there more than once, and does it line up with a higher-timeframe structure point? A level that only shows up on the 1-minute chart and nowhere else isn't worth marking. Do your level-marking on the 1-hour or 4-hour chart, then hunt for sweeps on your execution timeframe.
Objective Rules for Spotting a Real Sweep
Vague pattern recognition doesn't survive contact with live markets. You need thresholds you can code, backtest, and defend.
- Minimum breach size. Require the wick to clear the level by a fixed distance, something like 0.25 to 0.5 of the Average True Range on your execution timeframe. Anything smaller is noise, not a sweep.
- Close-back-inside condition. The candle that made the breach, or the very next one, must close back inside the level on the timeframe you're trading. No close, no confirmed sweep.
- Relative volume threshold. The sweep candle should show volume meaningfully above its recent average, not just a marginal tick up.
- Session filters. Sweeps during low-liquidity hours (holiday sessions, thin overnight action) produce more false signals; weight setups during main session overlaps higher.
- Higher-timeframe alignment. A sweep that lines up with a 4-hour or daily level carries more conviction than one that only exists on a 5-minute chart. Objective, testable rules like these are what let you actually backtest a liquidity sweep strategy instead of eyeballing it after the fact.
Run these four filters together, not one at a time — a disciplined approach explained in this complete guide on liquidity in investing helps clarify why liquidity matters for market moves. A sweep that clears the breach threshold but fails the volume test is still a coin flip.
Three Ways to Enter After a Confirmed Sweep
Once a sweep meets your objective criteria, you've got three realistic entry models, each with a different risk-reward and confirmation tradeoff.
- Immediate entry on the close-back-inside candle. Enter at or near the close of the confirming candle, using a market or limit order just inside the level. This gets you the best price but the least confirmation, so size it smaller.
- Retest entry. Wait for price to pull back toward the swept level after the initial reversal move. You give up some of the move, but your invalidation is cleaner and tighter.
- Lower-timeframe structure break entry. Drop to a 1-minute or 5-minute chart and wait for a break of structure or change of character before entering. This is the slowest trigger but the highest-confluence one, and it pairs well with signal confirmation methods that combine multiple timeframes before a scalp.
Limit orders reduce slippage on the immediate entry model but can miss fast moves entirely; market orders guarantee the fill but cost you the spread. Scale in across two of the three models, immediate plus retest, rather than betting everything on one trigger.
Pro Tip: If spread widens noticeably around the sweep, as it often does during news-adjacent sessions, treat the retest model as your default. Chasing an immediate entry into a wide spread is how a good read turns into a losing trade.
Stop Placement, Sizing, and Where to Take Profit
Your stop belongs just beyond the sweep wick, not at the level itself, with a small ATR buffer to absorb the noise of a second, shallower poke at the same price. Placing a stop exactly at the level all but guarantees you get swept out on the retest.
Size the position by fixed cash risk, not by a flat lot size. Decide what you're willing to lose in dollars, then work backward from your stop distance to the position size. This keeps every trade equal in risk regardless of how wide or tight the setup happens to be, a principle covered in more depth in this risk management checklist.
- Target the opposite liquidity pool first, since that's usually where the next cluster of stops and reactive orders sits.
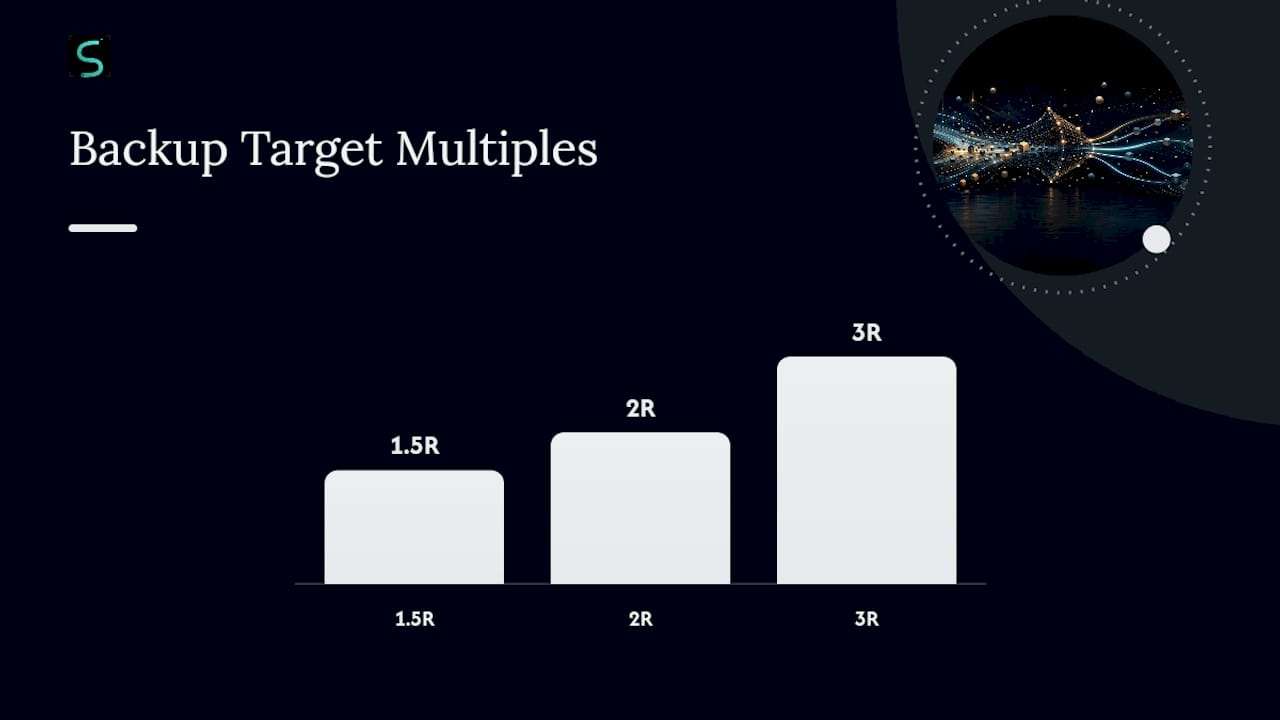
- Use fixed R multiples (1.5R, 2R, 3R) as a backup target when no obvious opposite pool exists.
- Take partial profit at your first target and let a runner ride with a trailing stop, detailed further in this exit strategy guide.
- Account for spread and fees before you calculate R, especially on lower timeframes where a few pips of slippage can erase a marginal edge.
- Set a time stop. If the trade hasn't moved in your favor within a defined number of candles, exit rather than let a stale position bleed.
Two Worked Examples: A Long and a Short
Long setup. Equal lows form on the 4-hour chart at 1.0850 over three separate touches. Price sweeps to 1.0838 (a 0.4 ATR breach) on a volume spike, then closes back at 1.0855. Entry triggers on the close, stop goes at 1.0830, target is the prior swing high at 1.0910, roughly 2.6R.
Short setup. Equal highs sit at 4,200 on an index future, tested twice. Price spikes to just beyond 4,200, closes back under 4,200 with elevated volume. Entry on the retest with stop beyond the sweep wick, target the session low around 4,160, aiming for a favorable risk-to-reward ratio.
- Mark the level before the session opens.
- Wait for the sweep event and measure the breach.
- Confirm with close, volume, and HTF alignment before entering.
- Log the outcome: timeframe, breach size, entry model, fees, realized R.
Review every trade afterward for what confirmation actually held up, not just whether it won.
How Indicator Tools Fit Into a Sweep Strategy
A liquidity sweep indicator flags wicks that clear a marked level and close back inside, usually built on confirmed pivots so it doesn't repaint mid-bar. Non-repainting detectors that check closed bars cut down on false positives compared to tools that fire on unconfirmed price action, but no indicator can tell you whether a level is genuinely significant. That judgment still needs a human eye on the higher timeframe.
- Use a sweep flag as an alert, not an automatic entry trigger.
- Layer volume, HTF level markers, and sweep flags into one dashboard so you're not tab-switching mid-trade.
- There are indicator stacks built in Pine Script v6 with non-repainting signals, volatility gating, and backtesting dashboards that let you validate a rule set before risking capital.
- Keep level marking and final confirmation manual. Tools accelerate the workflow; they don't replace the read.
The Mistakes That Wreck a Sweep Trade
Most losses on liquidity grabs come from one habit: entering before the close confirms the reversal. Chasing the wick itself, instead of waiting for the candle to close back inside, is how traders become the liquidity instead of trading it.
- Don't enter on the wick. Wait for the close.
- Don't mark levels that haven't been touched more than once; single spikes aren't real pools.
- Keep your cash risk fixed before you enter, not after.
- Skip setups around major news releases, when spread and slippage make your stop meaningless.
Pro Tip: Run through this checklist out loud before every entry: level marked, breach measured, close confirmed, volume checked, HTF aligned, stop placed. If you can't check all six, don't take the trade.
Building a Practice Plan Before You Scale Size
Define your rules in writing first: breach size, close condition, volume threshold, entry model. Then collect at least 30 examples on a demo account before risking real money. Consistent positive R across that sample, with slippage that stays stable rather than creeping up, is your signal to scale size. Review the stop-loss placement guide and the take-profit setup guide alongside your journal, since most rule failures trace back to exits, not entries.
— Tran
Where Scalping-Algo Fits This Workflow
Marking levels manually is one thing. Catching the sweep the moment it closes back inside, without staring at five charts at once, is another. Scalping-Algo's indicator suite runs on Pine Script v6 and delivers non-repainting buy and sell signals built for exactly the entry models covered here: immediate, retest, and lower-timeframe structure breaks.

The confluence tools flag volume spikes and higher-timeframe alignment automatically, so the four-part filter from earlier in this piece (breach, close, volume, HTF) runs in the background instead of eating your screen time. Volatility gating helps filter out the low-conviction sweeps that happen during thin sessions, and the backtesting dashboard lets you run your 30-example practice plan against historical data before you scale size. Pair that with webhook alerts and you get notified promptly when a level gets swept. Check the full indicator suite or see how the three-indicator system works on the Algo Master page to start testing this ruleset with your own capital.
Sources
- Liquidity Grab: How Smart Money Hunts Stops Before the Real Move — Oyamori
- Liquidity Sweep Trading | Learn the Concept & Risk Controls | Finelo
- Liquidity Sweep Detector — MQL5 Code Base
This article is general information, not a substitute for advice from a qualified financial advisor. Consult a qualified financial professional about your own circumstances before acting on anything here.
FAQ
Can You Predict a Liquidity Grab Before It Happens?
You can anticipate where one is likely, since equal highs, equal lows, and prior session extremes mark the obvious pools, but you can't predict the exact moment or size of the breach. That's why confirmation rules matter more than prediction.
Can You Make $1,000 a Day Day Trading Liquidity Sweeps?
Daily results depend entirely on account size, position sizing, and how many valid setups appear in a session, so there's no fixed dollar figure any strategy guarantees. A trader risking a fixed percentage of a larger account and hitting several 2R to 3R sweeps could clear that target on a strong day; a smaller account working the same rules simply can't.
What Is the 3-5-7 Rule in Trading?
Definitions vary across trading communities, and it isn't a standard framework tied to liquidity sweep trading specifically, so treat any single version you find online with caution rather than as an established rule.
What Is the Best Strategy for Trading Market Liquidity?
There's no single best strategy, but the most testable approach combines pre-marked liquidity zones, a measurable breach threshold, a close-back-inside confirmation, and a volume filter, backed by higher-timeframe alignment before entry. Tools like Scalping-Algo's non-repainting indicators can automate the alerting and backtesting layer of that process while you keep level marking and final confirmation manual.