

The purpose of a command center dashboard is to centralize prioritized, real-time trade signals and execution controls so scalpers can detect and act on 1–15m opportunities without switching tabs or losing context. This is not a passive display. It is an operational routing layer where pre-prioritized alerts arrive, confluence rules are enforced, and execution paths are pre-wired.
Three outcomes you get immediately:
- Faster detection-to-execution: Signal verification and order entry happen on one screen, not across four windows.
- Reduced cognitive load: Pre-defined confluence rules filter noise before it reaches you, built using TradingView Pine Script v6 alerts and Scalping-algo's indicator suite.
- Integrated risk controls: TP/SL overlays and volatility gates are visible at all times, not buried in a separate panel.
Table of Contents
- What does a command center dashboard actually do in live trading?
- Why do short-term scalpers need a command center more than swing traders?
- What components does every trader command center need?
- How do you design confluence rules the dashboard can actually enforce?
- How do you connect TradingView, webhooks, and broker APIs without killing your fill quality?
- How do you measure whether the command center is actually improving your results?
- What does a minimum viable command center setup look like?
- What mistakes do scalpers make with command centers and how do you fix them?
- Key Takeaways
- The command center is infrastructure, not a feature
- Scalping-algo's Command Center puts this into practice
- Useful sources and further reading
What does a command center dashboard actually do in live trading?
A command center centralizes real-time telemetry from multiple data streams into one actionable view, then routes prioritized alerts to the operator with direct execution links. The key functions are:
- Centralize telemetry: Aggregate price feeds, indicator signals, and broker status into one surface.
- Prioritize alerts: Rank incoming signals by confluence score so the highest-edge setups surface first.
- Route actions: Link each alert tile directly to an execution gateway or webhook endpoint.
- Integrate execution: Confirm fills, update risk overlays, and log the trade without leaving the screen.
The screen layout that works for scalpers has three layers. The status layer answers "Is everything live and connected?" at a glance: latency indicator, broker API status, and session P&L. The operational layer is where you spend most of your time: the prioritized alert feed, confluence panel, and one-click execution controls. The drill-down layer holds backtest summaries, session replays, and signal diagnostics you access only when investigating a miss.
A command center enables an organization to function as designed, performing day-to-day operations in a manner where everyone knows who is in charge when there is trouble. For scalpers, that means knowing exactly which signal owns your attention at any given second.
At a glance, your screen should show: signal priority rank, estimated slippage on the current instrument, and a green/red connectivity indicator. If you have to search for any of those three, the layout needs work.
Why do short-term scalpers need a command center more than swing traders?
Milliseconds matter when your entire edge lives on a 1m or 5m candle. A command center collapses the detection-to-execution window by moving you from passive watching to active governance. Swing traders can afford to deliberate. Scalpers cannot.
Scalper-specific benefits:
- No context switching: Every signal, confluence check, and execution control lives on one screen.
- Pre-enforced confluence rules: The dashboard only surfaces setups that meet your minimum confluence count, so you are not manually verifying each one under pressure.
- Automated webhook execution: Alerts fire directly to Discord or a broker gateway via Pine Script v6 webhooks, cutting manual latency.
- Consistent risk enforcement: TP/SL parameters are locked into the dashboard view and cannot be overridden mid-trade without a deliberate action.
The real-time signal advantage compounds when your dashboard enforces rules you already agreed to in a calm moment, not in the heat of a fast-moving candle.
Pro Tip: Set a single keyboard shortcut or on-screen button to acknowledge and accept a priority-1 alert. Pre-authorized micro-order acknowledgements cut hesitation time and remove the "should I?" pause that costs scalpers entries.
What components does every trader command center need?
The non-negotiables are six: a prioritized alert feed, a signal confluence panel, an execution controls and webhook manager, latency and connectivity indicators, a risk overlay showing live TP/SL, and a session start-of-day checklist with undo capability.

| Component | Why it matters for scalping | Implementation notes |
|---|---|---|
| Prioritized alert feed | Surfaces highest-confluence signals first; eliminates manual triage | TradingView Pine Script v6 alert conditions ranked by score |
| Signal confluence panel | Shows how many conditions align before you commit | Multi-timeframe overlay; Edge Finder order-block confirmation |
| Execution / webhook manager | Routes alerts to broker or Discord without manual copy-paste | Native TradingView webhook; verify idempotency on retries |
| Latency & connectivity indicators | Flags degraded fills before they cost you slippage | Monitor signal-to-fill roundtrip; alert if >500ms |
| Risk overlay (TP/SL) | Keeps risk parameters visible during fast price action | Projected levels from indicator suite; auto-update on fill |
| Session SOD checklist + undo | Confirms pre-session rules are active; allows fast rollback | Checkbox list; one-click disable for each active alert |
Optional but high-value additions:
- Snapshot export for post-session review and root-cause analysis
- Session replay tied to timestamped alert log
- Integrated backtest summary panel showing historical win rate for the current setup
- Named signal owners and escalation routes for team trading setups
How do you design confluence rules the dashboard can actually enforce?
Codify your critical signals and confluence rules before you wire the dashboard. The screen is the artifact of prior alignment, not the source of it. If you have not defined what a valid setup looks like, the dashboard will just display noise faster.
- Name your critical signals. List every indicator condition that can trigger a trade: Edge Finder order-block signal, MTF trend alignment, divergence confirmation.
- Set gating conditions. Define the volatility band and session regime required. No signal fires outside those bounds.
- Assign a minimum confluence count. Require at least two of three conditions to align before a setup reaches priority-1 status.
- Write a sample rule. Example: Edge Finder signal + MTF trend aligned + volatility within defined band = Priority 1. Edge Finder signal alone = Priority 3, monitor only.
- Assign trade ownership. Each priority level maps to a specific response: Priority 1 triggers an immediate webhook alert; Priority 3 logs to the review queue.
- Document escalation paths. If a Priority 1 alert is not acknowledged within a defined window, it escalates or auto-cancels.
For building high-probability setups, the rule structure above is the foundation. Without it, you are just watching a fast screen.
Pro Tip: During your build phase, set conservative defaults: require three confluence conditions instead of two, and gate out the first and last 15 minutes of the session. Tighten only after you have 20+ live sessions of data confirming the rules hold.
How do you connect TradingView, webhooks, and broker APIs without killing your fill quality?
The practical integration stack is: TradingView Pine Script v6 alert → webhook URL → execution gateway → broker API. Every link in that chain adds latency, and every point of failure costs you a fill.
- TradingView alerts: Configure alert conditions in Pine Script v6. Use the native webhook field to POST a JSON payload to your gateway endpoint.
- Webhook payload: Include instrument, direction, quantity, and a unique idempotency key. Without the key, a retry on a dropped connection can double your position.
- Authentication: Secure the endpoint with a shared secret or token header. Never expose a raw webhook URL.
- Gateway routing: The gateway validates the payload, checks rate limits, and forwards to the broker API. Log every inbound message with a timestamp.
- Broker API: Confirm the order type your broker supports. Market orders fill faster; limit orders reduce slippage but risk non-fill on fast moves.
For a complete automation workflow, each step above needs a documented runbook so you can diagnose failures in real time.
| Latency point | What to monitor | Target threshold |
|---|---|---|
| Signal generation (Pine Script) | Bar close to alert fire | <100ms on standard plan |
| Alert delivery (TradingView → webhook) | Webhook receipt timestamp | Low latency typical |
| Gateway routing | Inbound to outbound order | <50ms internal |
| Broker order roundtrip | Order sent to fill confirmation | Low latency for market orders |
Non-repainting indicators are non-negotiable in this stack. A repainting signal fires an alert on bar close, then recalculates and invalidates the setup retroactively. You have already entered. The fill is real; the signal is gone.
How do you measure whether the command center is actually improving your results?
Track five KPIs: detection-to-execution time, win rate, average slippage, realized edge per trade, and false positive rate. If the dashboard is working, detection-to-execution time drops and false positive rate falls as your confluence rules tighten.
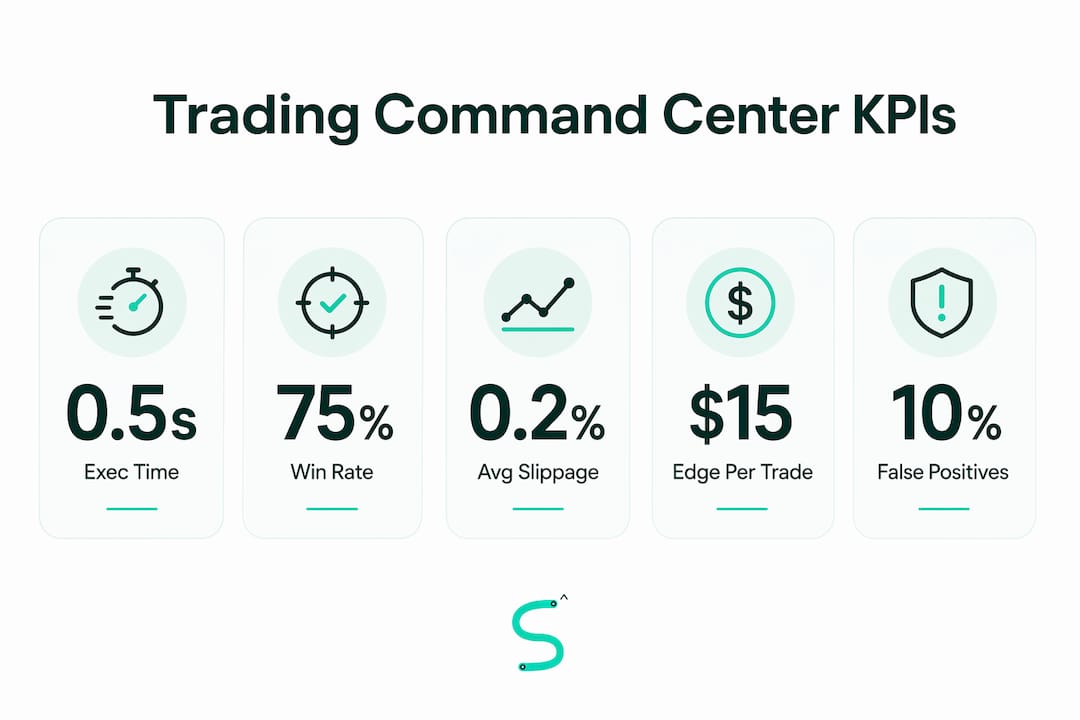
| KPI | Definition | How to capture | Scalping target |
|---|---|---|---|
| Detection-to-execution time | Alert fire to order submission | Gateway timestamp log | <2 seconds |
| Win rate | Profitable trades / total trades | Broker fill report | Baseline from backtest |
| Average slippage | Expected fill vs. actual fill | Broker execution report | Low slippage on liquid instruments |
| Realized edge per trade | Actual P&L vs. projected TP | Trade log vs. indicator TP | Positive over 20+ trades |
| False positive rate | Alerts fired with no valid setup | Alert log vs. confluence rules | <15% of total alerts |
Testing methodology:
- Export a 30-session alert log with timestamps and confluence scores.
- Match each alert to the corresponding broker fill or non-fill.
- Calculate each KPI above for the baseline period.
- Change one dashboard variable (e.g., raise minimum confluence count from 2 to 3).
- Run 20 more sessions and compare KPIs. Change one variable at a time.
When performance regresses, pull the session replay and the alert log for the affected period. Cross-reference the alert timestamps with price action to identify whether the failure was a signal quality issue, a latency spike, or a rule gap.
What does a minimum viable command center setup look like?
The MVP is the smallest configuration that lets you trade live reliably: a prioritized alert feed, confluence panel, execution webhook, risk overlay, and latency indicator. Everything else is optional until you have 20 live sessions of data.
Build timeline:
- Days 1–2: Define your signal hierarchy and confluence rules on paper. Name every condition and its priority level.
- Days 3–4: Configure TradingView alerts and webhook endpoint. Test in sandbox with paper trades.
- Day 5: Run a full beta session with real alerts but no live orders. Log every alert and check latency at each point.
- Days 6–7: Fix any latency or payload issues found in beta. Confirm idempotency keys are working.
- Day 8+: Go live with conservative confluence thresholds. Review KPIs after each session.
Cost ranges: A DIY setup using TradingView's paid plan plus a lightweight webhook gateway runs roughly $50–$100 per month. Hosted solutions with built-in execution routing and analytics run higher. The essential tools for scalpers guide covers platform-specific cost breakdowns in more detail.
Pre-launch checklist:
- Confluence rules documented and loaded
- Test alerts fired and received at gateway
- Failover plan defined (what happens if webhook endpoint goes down)
- Rate-limit checks confirmed with broker API
- Signal ownership assigned for each priority level
- TP/SL parameters locked in risk overlay
What mistakes do scalpers make with command centers and how do you fix them?
The most damaging errors are not technical. They are operational.
- Treating the screen as the strategy. The dashboard enforces rules you define. If the rules are vague, the dashboard surfaces noise confidently. Fix: write your confluence rules before you build anything.
- Missing ownership. Every alert tile needs a named response. "Someone will handle it" means no one does under pressure. Fix: assign a priority level and a response action to every signal type.
- Noisy alerts. Too many low-priority alerts train you to ignore the feed. Fix: throttle non-critical alerts to a separate log; only Priority 1 and 2 reach the main feed.
- Ignoring latency. A 2-second delay on a 1m chart is a missed trade. Fix: log gateway timestamps and review latency weekly.
- Over-building before validating. Adding session replay, snapshot export, and analytics before the core alert feed is stable. Fix: get the MVP live first, then layer features.
The key failure mode is building around readily available data instead of the core business question. For scalpers, that question is: "Does this setup meet my confluence threshold right now?" Every element on the screen should answer that question or support the execution that follows.
Key Takeaways
A command center dashboard only improves scalping outcomes when it enforces pre-defined confluence rules and routes execution automatically, not when it simply displays more data.
| Point | Details |
|---|---|
| Define your one question | Every dashboard element must answer "Does this setup meet my confluence threshold?" — nothing else. |
| Automate gating for volatility | Use Pine Script v6 volatility conditions to gate alerts before they reach the feed, not after. |
| Measure detection-to-execution time | Target under 2 seconds from alert fire to order submission; log gateway timestamps every session. |
| Start with the MVP | Build the prioritized alert feed, confluence panel, webhook, risk overlay, and latency indicator first. |
| Scalping-algo delivers the full stack | Scalping-algo's Command Center pairs Edge Finder signals, Pine Script v6 webhooks, and a backtesting dashboard in one subscription. |
The command center is infrastructure, not a feature
Most traders I work with approach the command center as a convenience upgrade. They build it after they have a strategy, as a way to see more at once. That framing gets it backwards.
The command center is the operating environment your strategy runs inside. Without it, even a well-designed confluence system degrades under live conditions because the trader is manually verifying, manually routing, and manually enforcing rules that should be automatic. The cognitive overhead alone costs entries.
What changed for traders using Scalping-algo's institutional-grade tooling was not the signals themselves. The signals were already there. What changed was the elimination of the gap between "signal confirmed" and "order submitted." The open-source Pine Script v6 scripts make the logic transparent and auditable, which means traders trust the alerts enough to act on them without second-guessing. That trust is what collapses the detection-to-execution window. Build the infrastructure first. The strategy performs better inside it.
Scalping-algo's Command Center puts this into practice
Scalping-algo's Command Center is the direct implementation of everything covered in this guide: a single subscription that delivers prioritized real-time signals, confluence enforcement, and webhook-ready execution for 1–15m scalpers on TradingView.

Key capabilities tied to the sections above:
- Edge Finder order-block detection surfaces high-probability setups with confluence scoring built in.
- Pine Script v6 alerts fire non-repainting signals directly to your webhook endpoint or Discord channel.
- Backtesting dashboard lets you validate confluence rules against historical data before going live.
- Discord execution alerts deliver priority-1 signals to your phone or desktop with zero manual routing.
- Open-source scripts give you full visibility into the signal logic, so you know exactly what the dashboard is enforcing.
The full indicator suite is available on monthly, yearly, and lifetime plans. If you want to see how the three-indicator system maps to the command center setup described here, the Algo Master system page walks through the exact configuration.
Useful sources and further reading
- Stop Building Dashboards. Build a Command Center. — Tygart Media: Best for UI layout patterns, triage design, and the status/operational/drill-down layer model.
- From dashboards to governance: the rise of operational command centers — EQ Engineered: Best for understanding active governance vs. passive reporting and execution integration.
- Why every business needs a command center dashboard — LevelUp / Gitconnected: Best for ownership models, confluence alignment, and the "start from the business question" principle.
- What Is a Command Center Solution? — Primate Tech: Best for feature set standards, redundancy expectations, and cross-sector implementation context.
- Execution Framework: Improve Financial Reporting — Ready Accounting: Best for data aggregation architecture and KPI reporting design.
- What Is Command Center in Trading: A Complete Guide — Scalping-algo: Deeper conceptual primer on centralized trading dashboards.
- Automation Workflow for Traders: Build It Right — Scalping-algo: Webhook workflow and automation best practices for TradingView integration.
- How to scalp trade: Strategies, tools, and edge-proofing — Scalping-algo: Broad scalping strategy guide that pairs with the setup checklist above.
This article is general information for educational purposes. It is not financial or investment advice. Confirm all trading rules, platform capabilities, and risk parameters with the relevant primary sources or a qualified professional before trading live.